Prompt Buddy Power BI Template
I woke up one morning and had the urge to create a Power BI template for Prompt Buddy. You know how it is.
This is not the story of how you install it. The Power BI Template file can be found on GitHub from the link above including installation instructions. This is the story of how it’s made and how you can continue build it out with more features!
Here are the sections we’ll review:
- Transformation and Queries
- Measures
- The Value Calculator
- Theme
- Ideas for next steps and further features
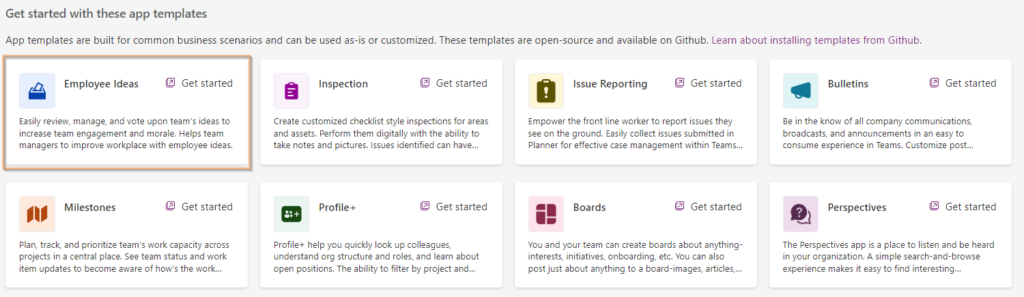
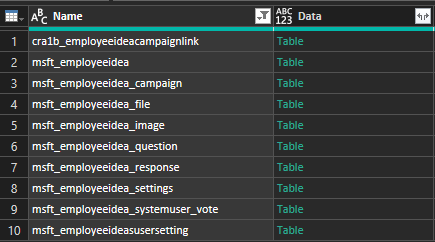
One thing that’s useful to know is that Prompt Buddy is a custom built app that is based on the Employee Ideas template app. If you open PowerApps in Teams you can start building your own app from scratch or you can start by customize a template and save lot’s of time! Anyway – the reason I’m telling you this is because it’ll make the tables names make much more sense as we go along in the post.
Transformation and Queries
The Power BI template utilizes 1 parameter, 2 functions and 6 queries.
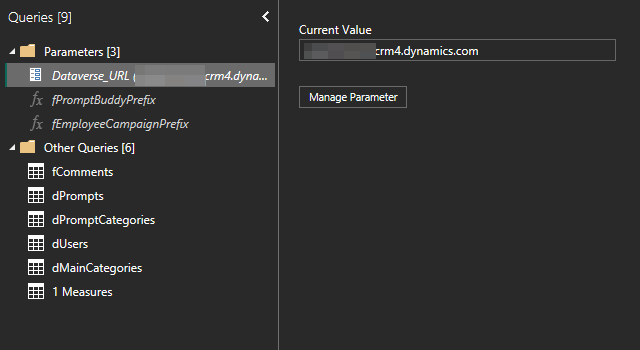
The parameter is used to determine what URL to fetch data from. This is the Dataverse for teams environment in which you install Prompt Buddy so it needs to be set dynamically for each new installation. The reason I’m going for a parameter here is also that it’s automatically asked for when starting a new Power BI Template file!
This is also the reason why I’m not using parameters for the prefix functions. You see, in every Dataverse environment, there are prefixes on custom tables and since they’re not the same between environments, I need to fetch the prefix. Sure, I could just ask the user in a parameter and write an instruction on how to find it, but that’s not very user Friendly!
Here’s how it works.
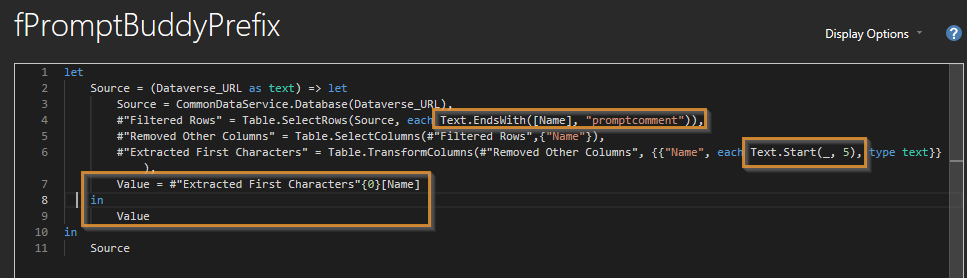
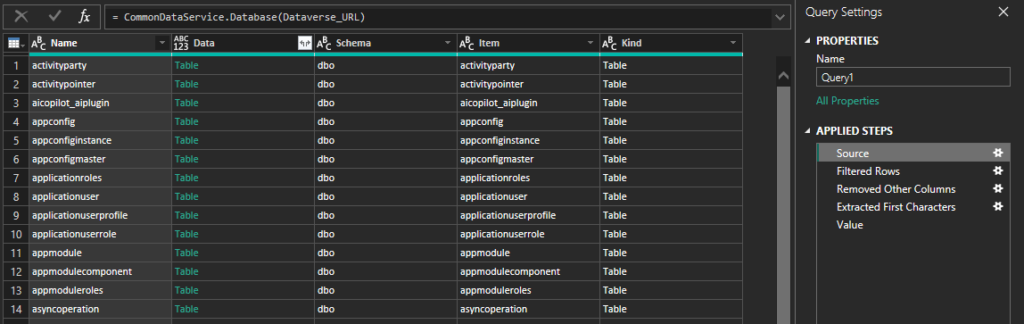
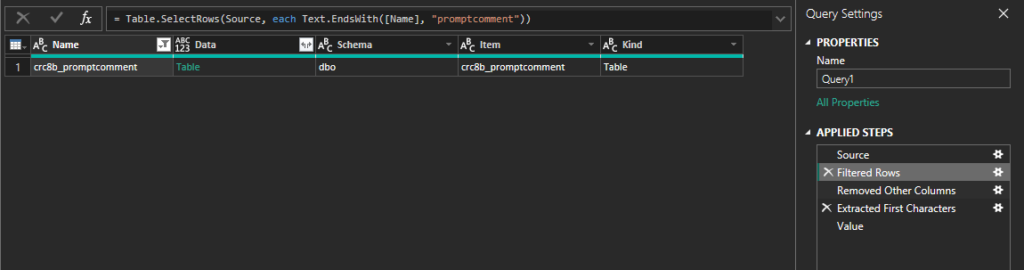
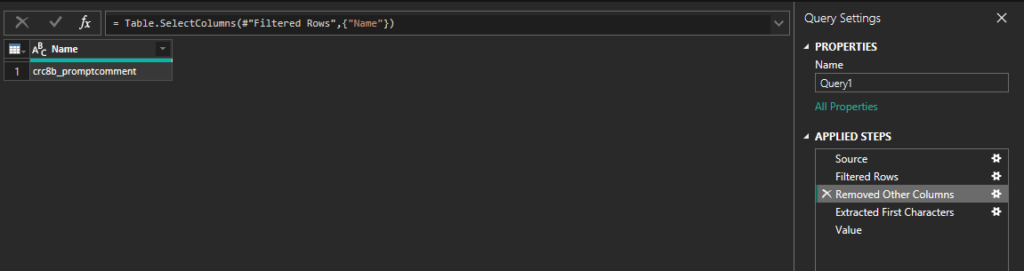
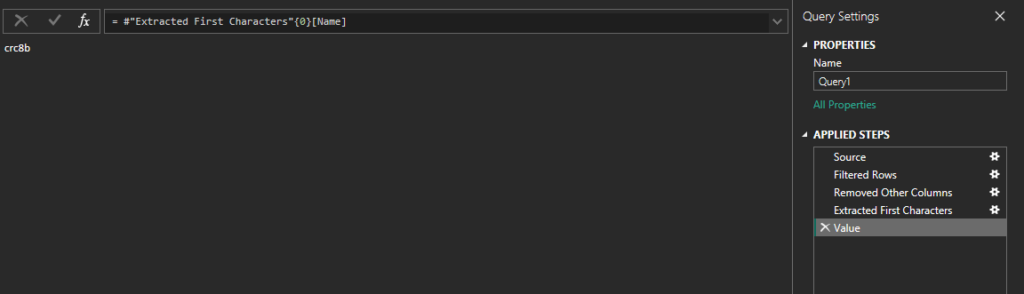
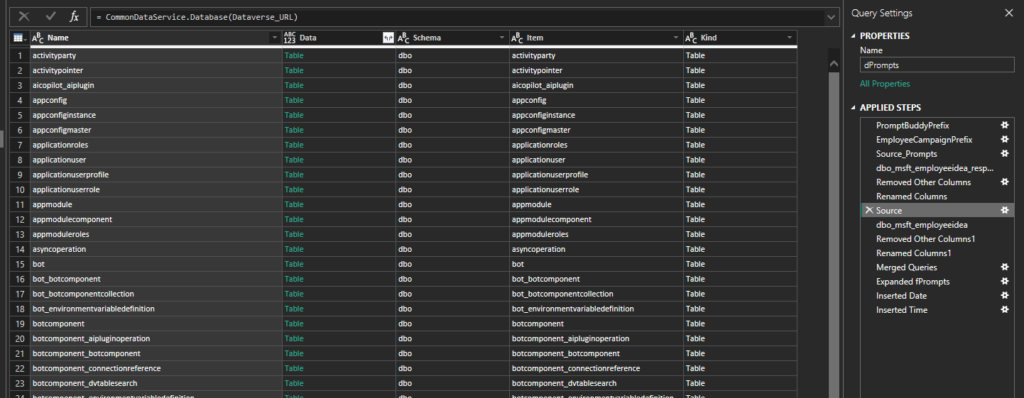
When you install Prompt Buddy, there’s always a table named “Promptcomment” that is created. It has the prefix we’re looking for! I connect to the Dataverse URL specified in the parameter but instead of opening up any of the tables, I filter out all other tables except for promptcomments, then I remove every other column except the Name-column and finally I extract the first 5 characters (the prefix!).
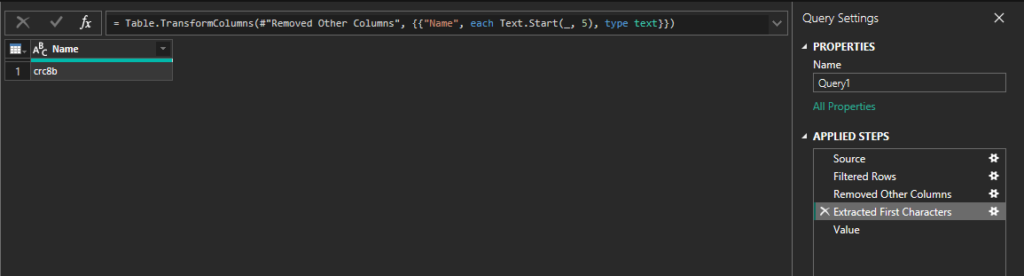
The final step converts the table query to a single text value.
Both functions work the same way but selects different standard tables for Prompt Buddy.
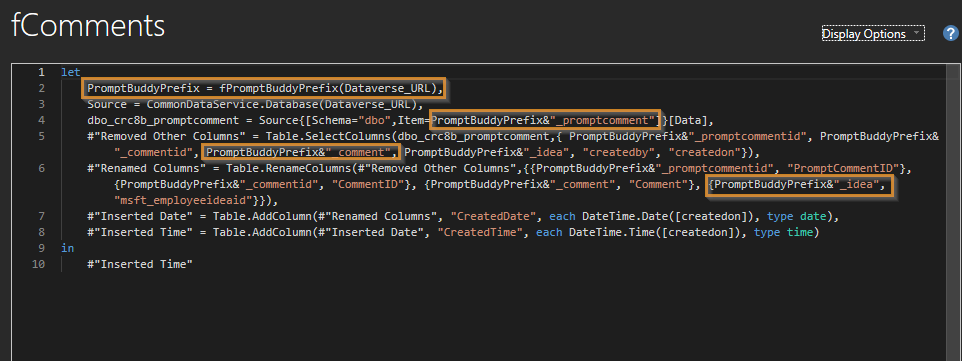
The queries with this prefix uses the function like this. It begins by fetching the value and then it uses the dynamic prefix to select the correct table, remove other columns as well as rename them, since the prefix-name is also included in the column names inside the table.
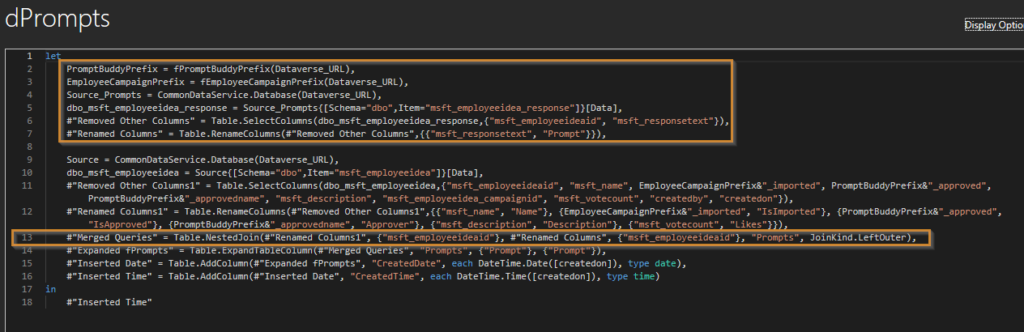
The query for Prompts is a little bit interesting so let’s look closer at that one. It’s actually made up from a merge between 2 tables, but I’m using a single Query for it. I’ve been looking for a reason to make use of this feature in Power Query for a while now 😀
I’ve already told you that the Prompt Buddy is based on the Employees Idea-app. The way Prompt Buddy stores a Prompt is by putting the name and description into the msft_employeeidea table and the actual prompt into the msft_employeeidea_response tables.
What I’m doing is first connecting to the msft_employeeidea_response table where I keep the msft_employeeideaid field as well as the prompt field. Then I restart with a new source in the middle of the query, this time connecting to msft_employeeidea. I keep the msft_employeeideaid field in here as well and on row 13, I merge the 2 queries, giving me the prompt from the first table and the name and description from the second without the need for multiple queries on the left side.
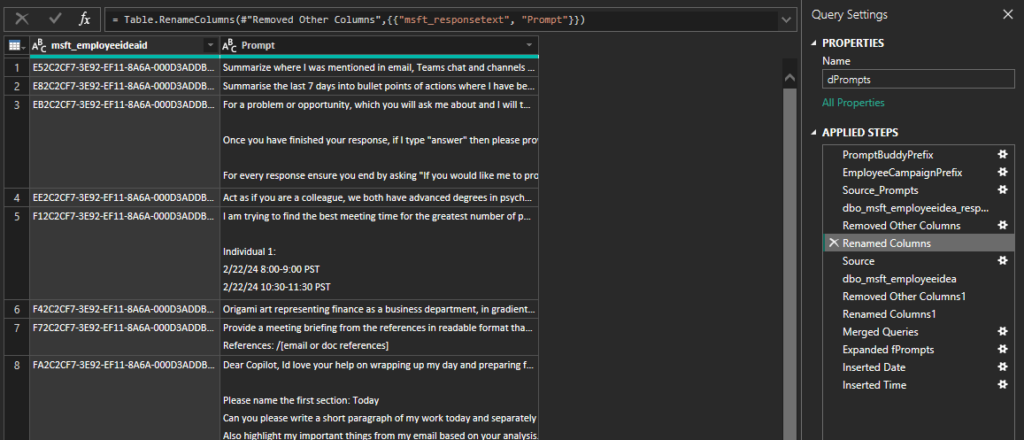
OK so have a look. On the Renamed Columns step it look like this.
The it goes back to the source again like this:
I think these are the only queries that really needs any further explaining. The rest is a bit more straight forward, besides I’m always here to answer the comments if you have specific questions!
Measures
This report doesn’t have that many measures to begin with and many of them are really easy.
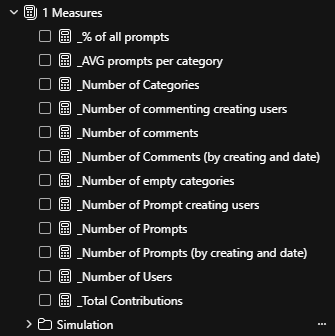
Number of Prompts and categories couldn’t be easier 😉


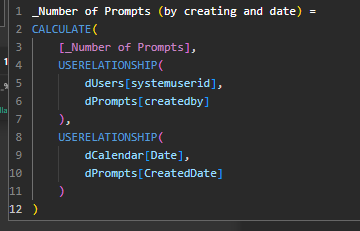
I do however have a model where the same user can create the prompt but also a comment on that same prompt and I can only have one such relationship active at a time. I’ve decided to have both inactive and then activate them inside measures instead. The same is true for the calendar.
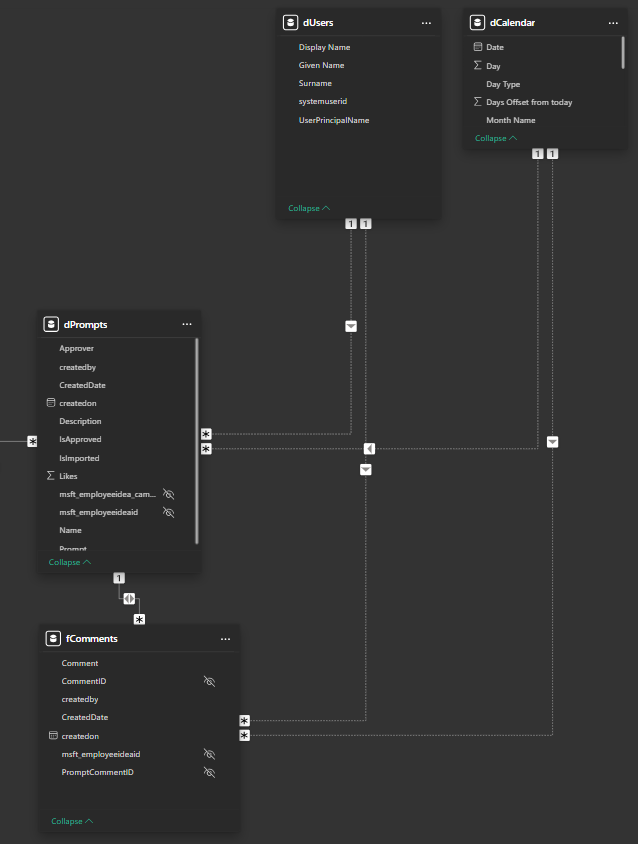
In such cases, the measure activates the suitable relationship for both users and dates like this:
There are measures in the Simulation Display folder but those are described in the next section.
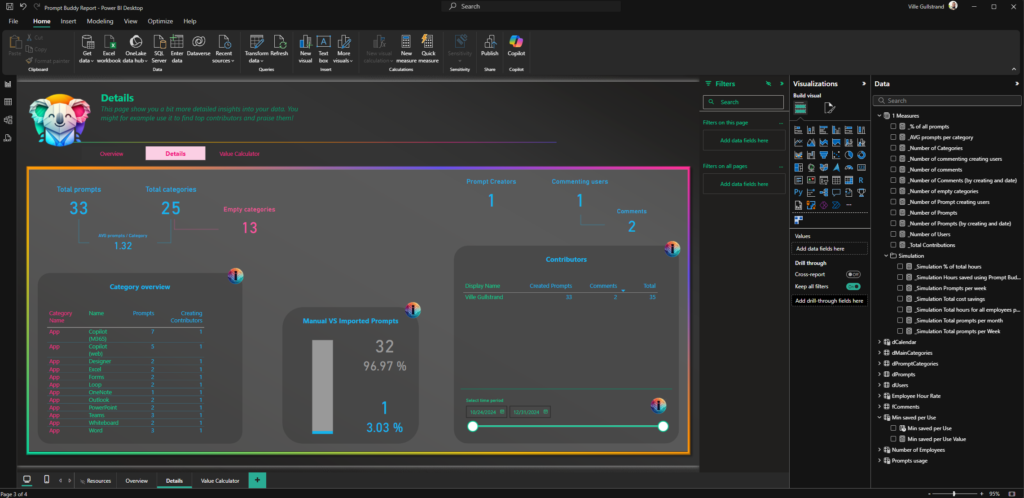
The value calculator
The Value Calculator page is mainly a big text field, but there’s actually lots of calculations going on in the background.
For example, on the left side we have 4 slicers. These slicers are set from a field in DAX tables and in the description next to it, the metric is the measure of the selected value.
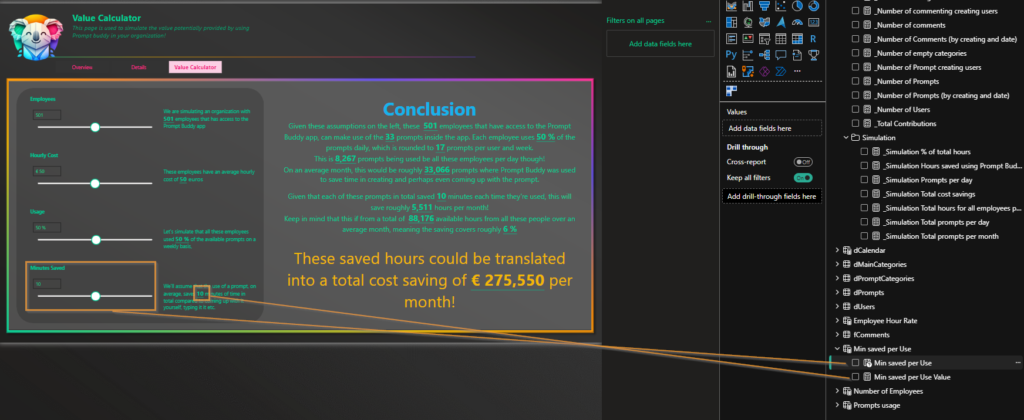
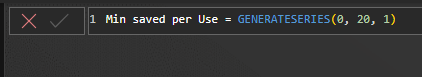
You can change these values as you see fit. Each table is just a generated series of numbers. For example, the Min Saved starts at 0, goes to 20 in increments by 1. This means you can select 1 full minute saved up to a maximum of 20 minutes. If you prefer to have 30 seconds increments, simply change the 1 at the end to 0.5 and if you want to calculate based on an ever greater time saving than 20 minutes per prompt usage, change the 20. All the other tables works the same way so I’m not going into details of each.
In the text block, some metrics are used again. You can see the relationship here. Note though that each bold, slightly larger and underlined value in the text is a calculation and there are far more than the ones with lines here.
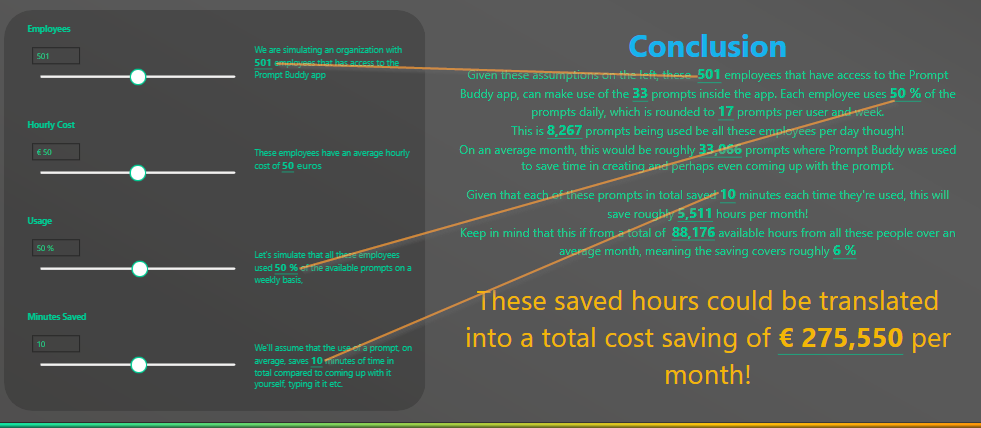
The other metrics here are calculated with measures.
They’re all really simple though. Mostly one value multiplied by another, like this to get the number of prompts used on a weekly basis. The number of prompts are the total number you have in Prompt Buddy 😉 Increase the prompts you have in there to increase your savings!

I’ve also made it really simple by multiplying the weekly value by 4 to get a monthly value.

In the same manner, I’ve used this to get the total number of available hours for all employees on a monthly basis. It’s not exact but it’s good enough.

Theme
Here’s how I created the theme, and really how I most often create themes.
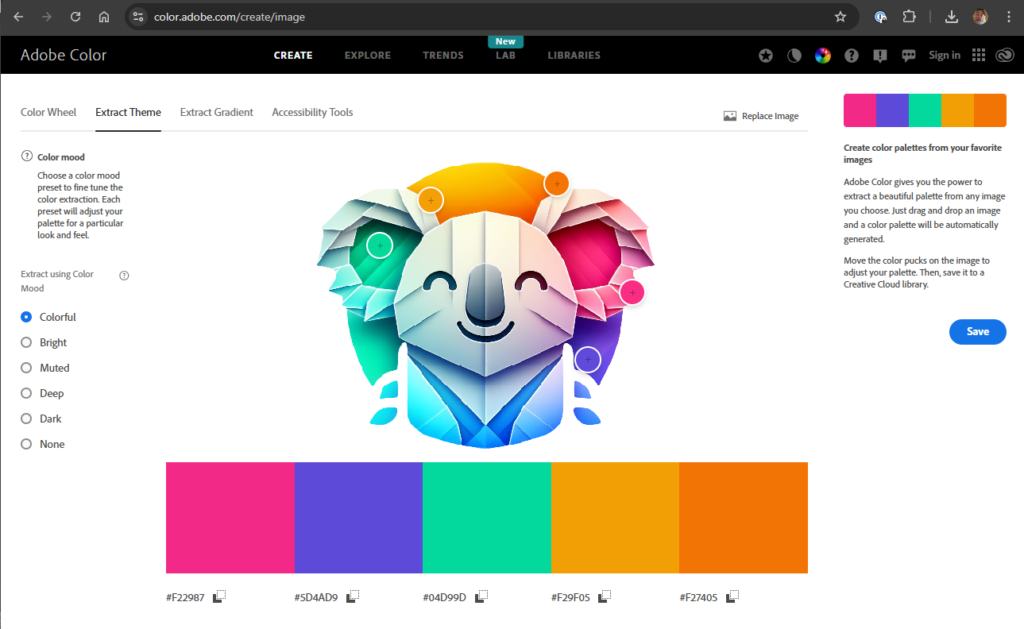
Step 1 – Getting the HEX codes
I like to use Adobe Color. I took the Prompt Buddy logo, uploaded it and started putting the dots in different areas to get the HEX codes.
Step 2 – Creating layout
With the HEX codes, I fired up PowerPoint and created 2 pages. One for the background on the canvas and one for the wallpaper. I imported the logo and the rest is really just rectangles with gradient colors.
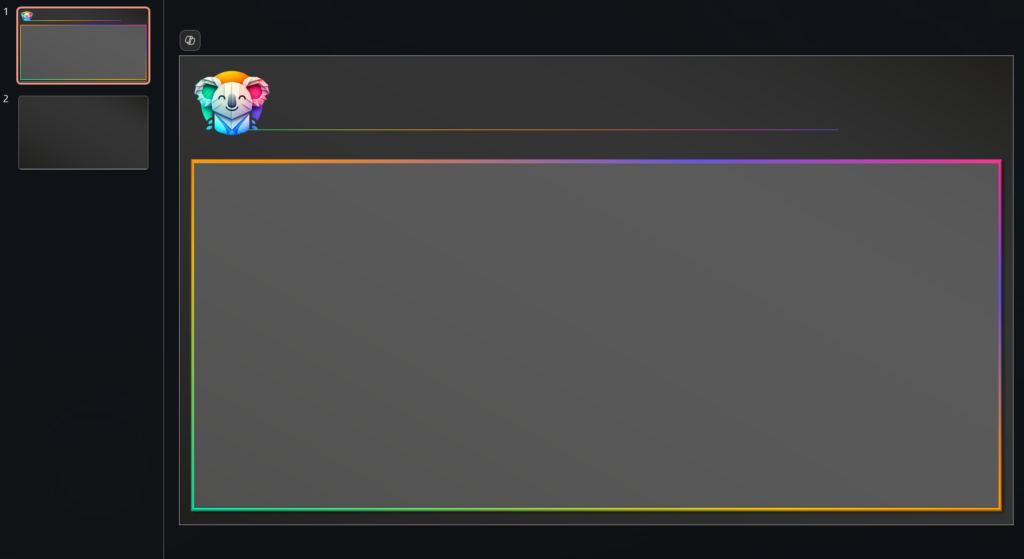
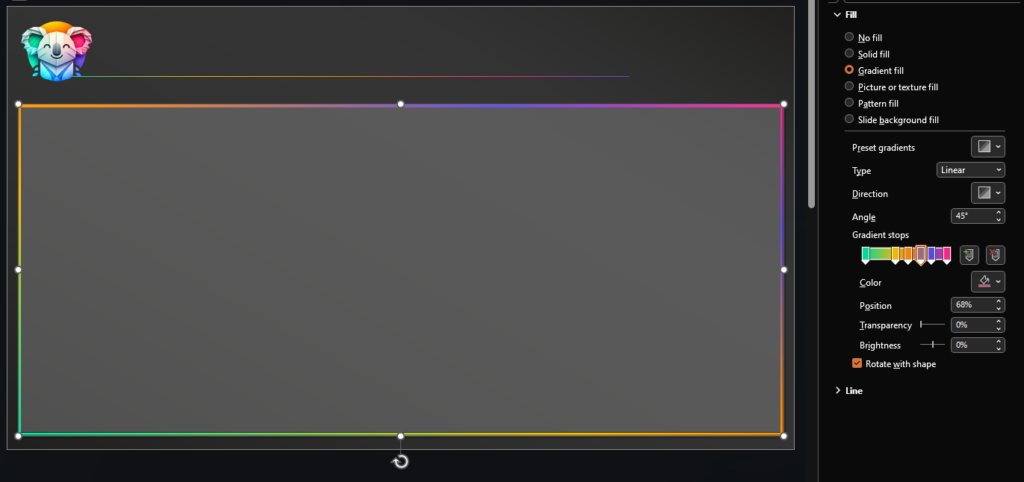
To get the middle rectangle with colorful borders I made a larger rectangle with a gradient like this, then put the grey one on top. This gives the impression of a colorful border.

The border colors are of course set to the hex codes from the logo
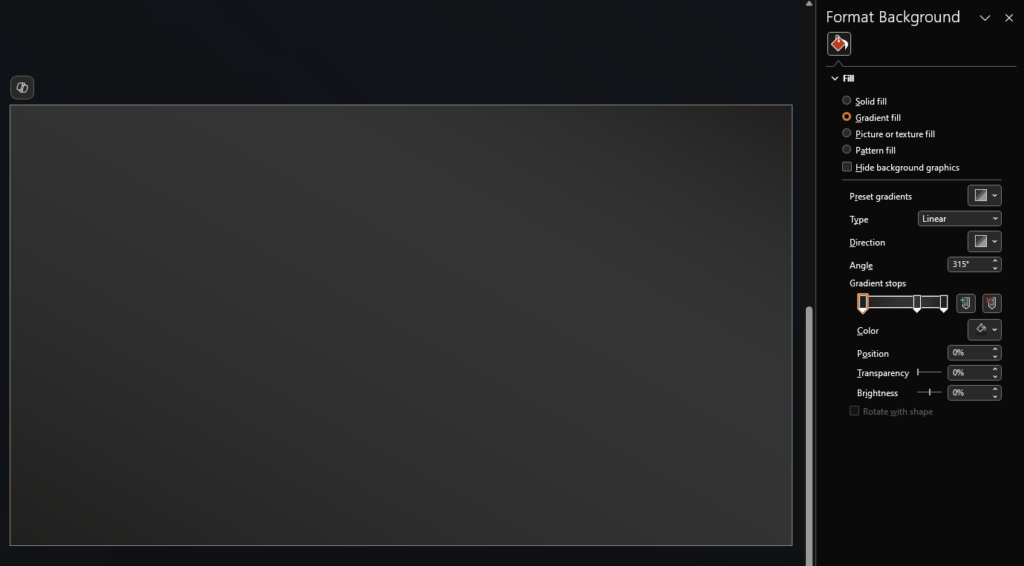
The wallpaper is just a gradient dark grey shade like this:
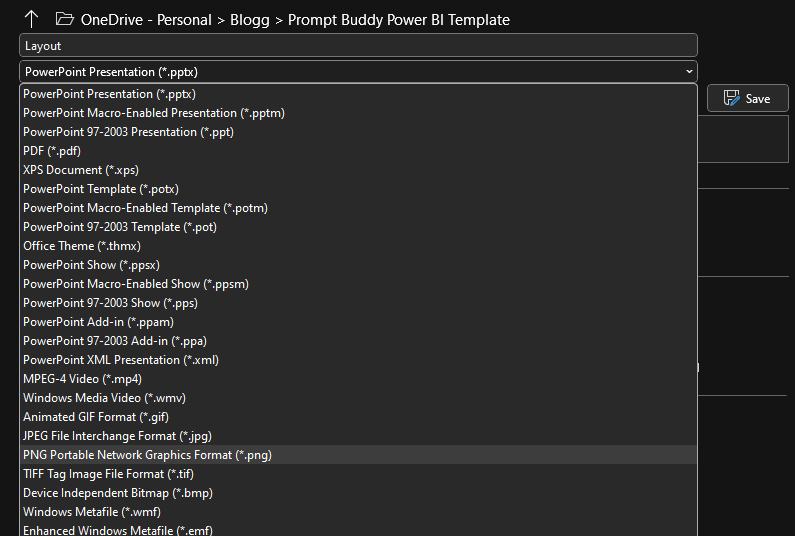
Finally – I save the pages as PNG images:
Step 3 – Creating the Power BI JSON theme
I almost always use the Theme generator by point-gmbh.com!
Start by setting the default colors and the names.
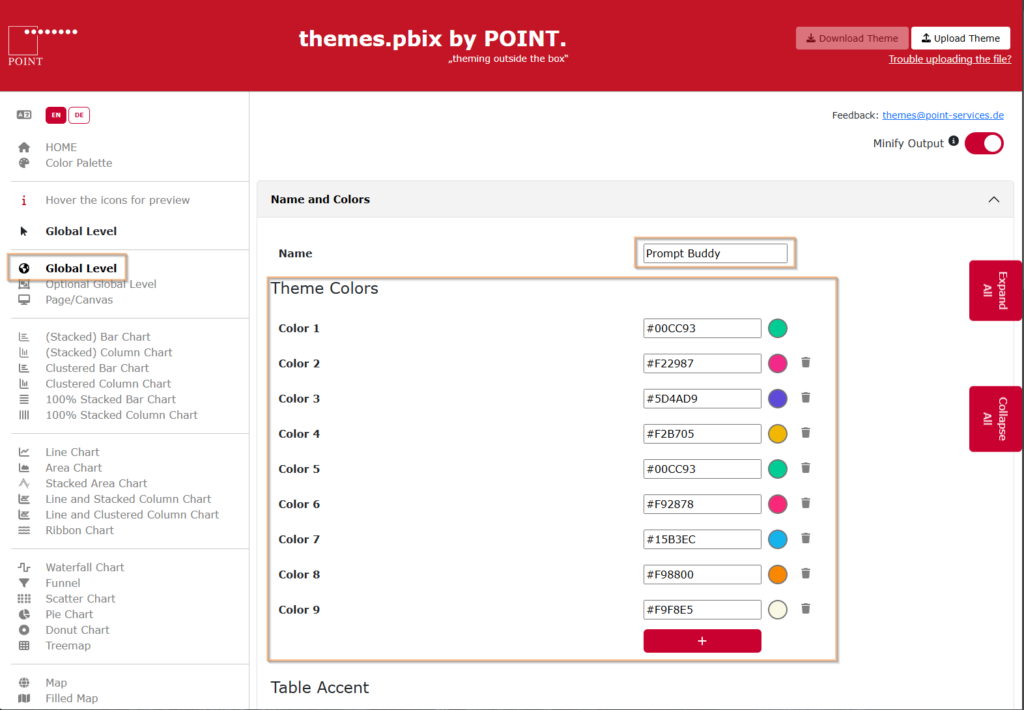
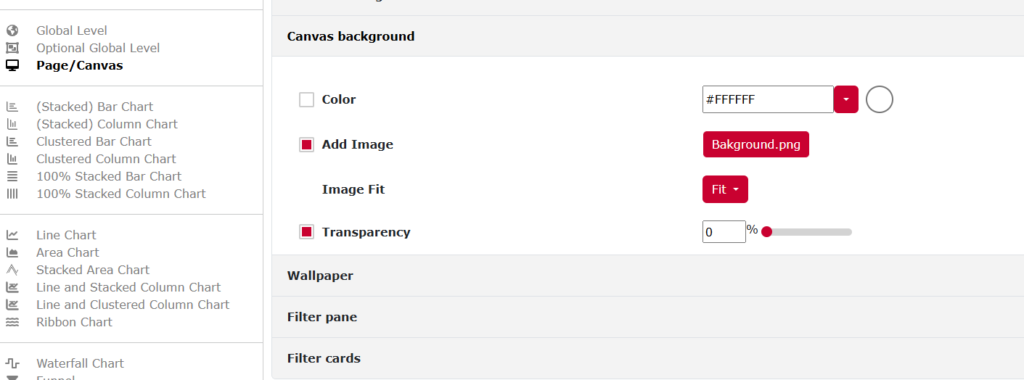
I upload the background and wallpaper here as well. This theme creator converts the images to base64 and adds it to the theme so that all pages get’s this layout template.
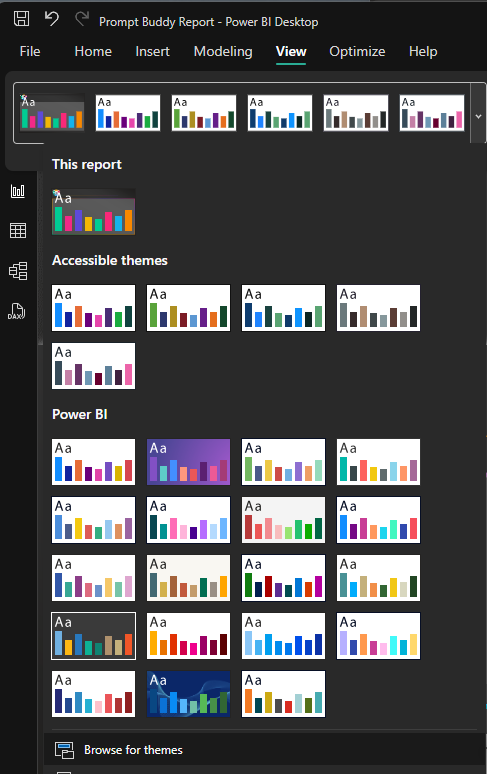
Step 4 – Import theme
Back in Power BI Desktop, I imported the JSON theme that I downloaded from the theme creator above.
Step 5 – Manual adjustments
Now there’s only one thing that the theme file cannot support at the moment (that bothers me) and that’s the page size. I prefer to have a bit larger sizes than the standard. Typically I go for 900×1600.
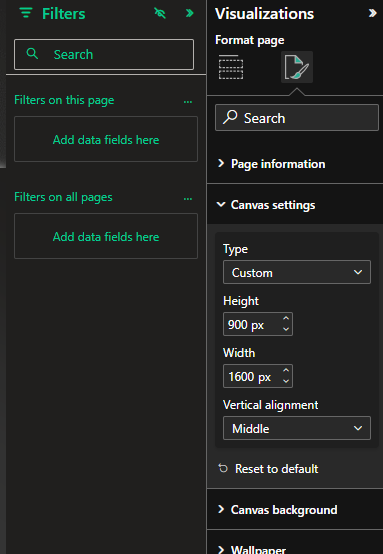
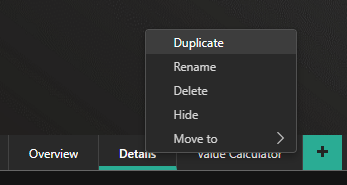
This only applies to the current page though, so I like to set this on the first page I create and instead of just using the plus sign to create the next page, I duplicate the one I already have. This keeps the size settings for the next page (and it saves time to add head lines and description texts in the exact spots)
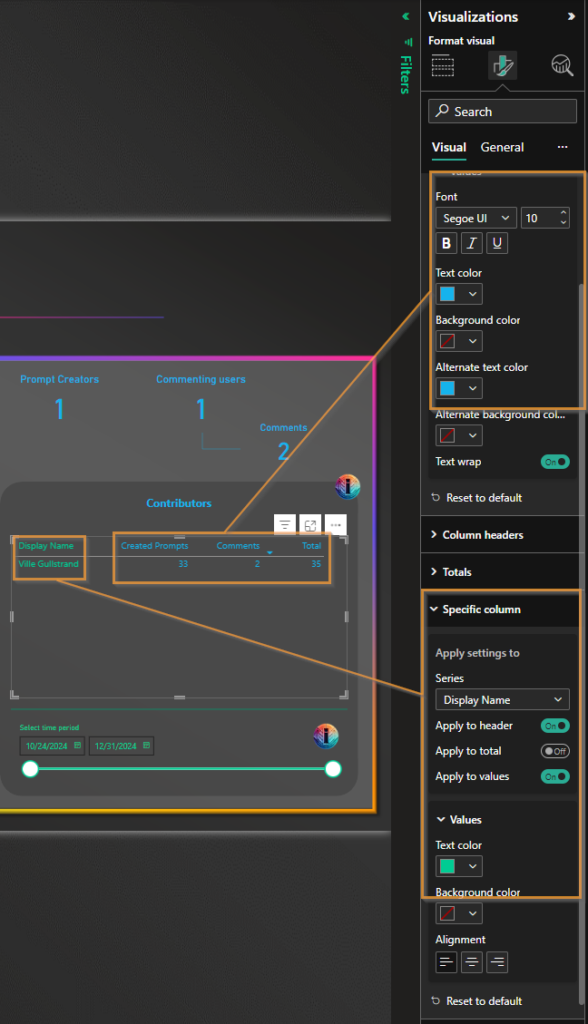
To get the different colors for different fields/columns, I set the default value color to Blue and then I head into specific columns settings to set the colors for headers and values like this:
Ideas for next steps and further features
Approved follow up
In the settings table, there’s the ability to require Prompts to be approved before they’re published. You can also set approvers. One natural thing to consider could be a follow up! If you are an approver, how many prompts have you approved/denied? Most importantly, have you not used this power at all? Perhaps you don’t need to be an approver then?
It might also be interesting for track how long it typically takes from a new prompt being submitted until it’s approved. You want your users to have the best experience! Make sure they have access to the best prompts as fast as possible!
More tables
There are more tables in the Employee Ideas app (and thus the Prompt Buddy app) than I’m using, so one natural step if you’re looking to build this out is to crack open the rest of them as well and add to your model!
Adding Activity Tracking
In some apps where it’s important to keep track on the activity, I’ve build in patching to an Activity table in a few places. It could be when you open a page in the App, click a button, change a value etc. This way, I’m able to follow up exactly who made a change inside the app without using the actual audit logs but most importantly I can get a better understanding on what is used more or less often so that I can adjust the app for the best possible experience. In this case, it could be keeping track on how often a prompt is opened in the app. This could then be visualized in the Power BI template.
If you have any questions or feel like I missed important parts of the template that needs describing, please feel free to reach out in the comments or find me on LinkedIn!
Cheers!