Parallel queries with Kolada
Let me just begin by saying that this solution is not something that 99.9% of the Power BI reports out there will have any use for as I honestly think it’s taking more time and calculations than you gain in most situations. In this very particular one it might make sense though, so let’s have a look at what I found.
A few weeks back I wanted to have a look at the open data from Kolada. They have an API to fetch data and I figured it could be an interesting case for me to also learn more about Power Query and functions.
The Kolada API calls I was looking for looked something like this:
http://api.kolada.se/v2/data/municipality/<Municipality ID>/year/<Year>
I just needed to change the Municipality ID and Year to actual values to get a response!

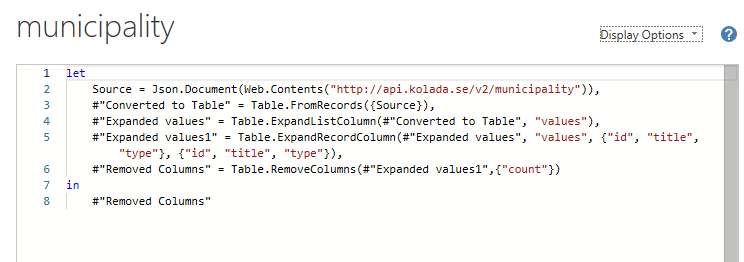
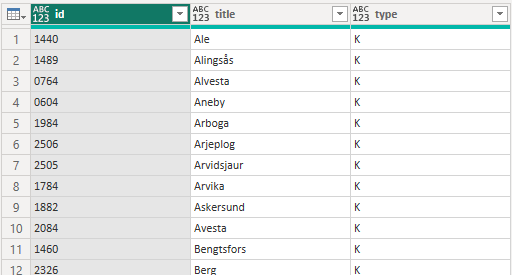
Getting the Municipality ID’s was super simple! I just asked for them and voilá!
Next step was to add the years for each municipality. There where 2 options I considered.
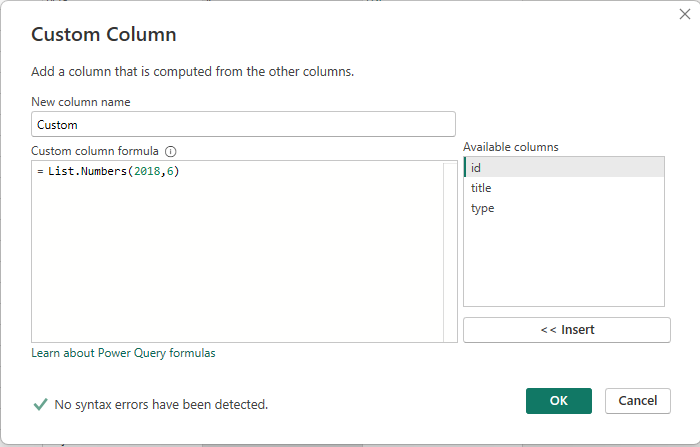
One way is to reference the Municipality Table, remove the regions (filter on only K) and then add a custom column with a list of years for each row:
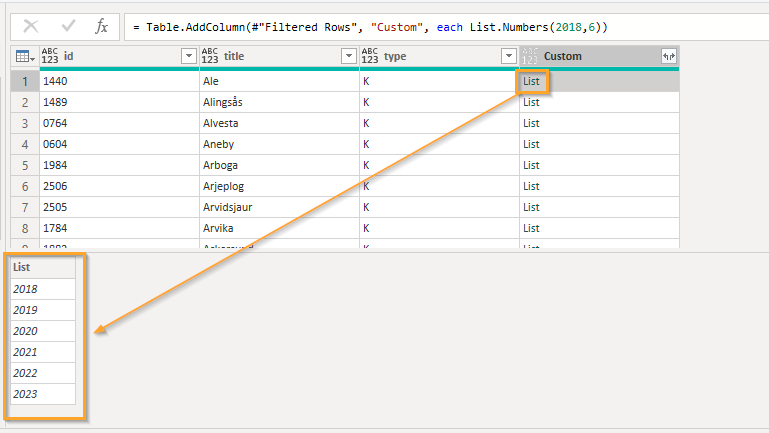
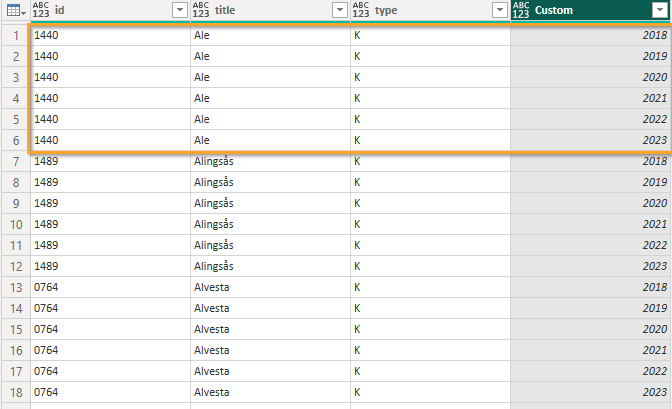
As you can see there’s now a list on each row with the years
Expanding these values as new rows:
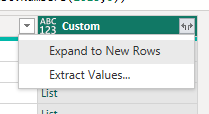
And just like that I have 6 rows per municipality!
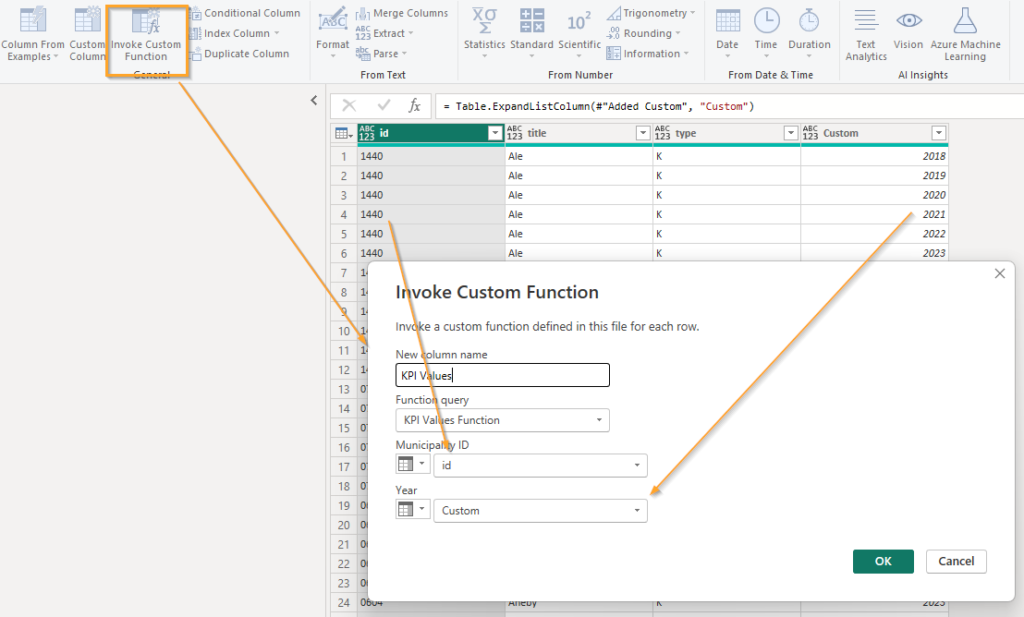
The fetch more information about the KPIs for each municipality and year, I created this function:
let
Source = (#"Municipality ID" as text, #"Year" as text) => let
Source = Json.Document(Web.Contents("http://api.kolada.se/v2/data/municipality/" & #"Municipality ID" & "/year/" & #"Year")),
values = Source[values],
#"Converted to Table" = Table.FromList(values, Splitter.SplitByNothing(), null, null, ExtraValues.Error),
#"Expanded Column1" = Table.ExpandRecordColumn(#"Converted to Table", "Column1", {"kpi", "municipality", "period", "values"}, {"kpi", "municipality", "period", "values"}),
#"Expanded values" = Table.ExpandListColumn(#"Expanded Column1", "values"),
#"Expanded values1" = Table.ExpandRecordColumn(#"Expanded values", "values", {"count", "gender", "status", "value"}, {"count", "gender", "status", "value"})
in
#"Expanded values1"
in
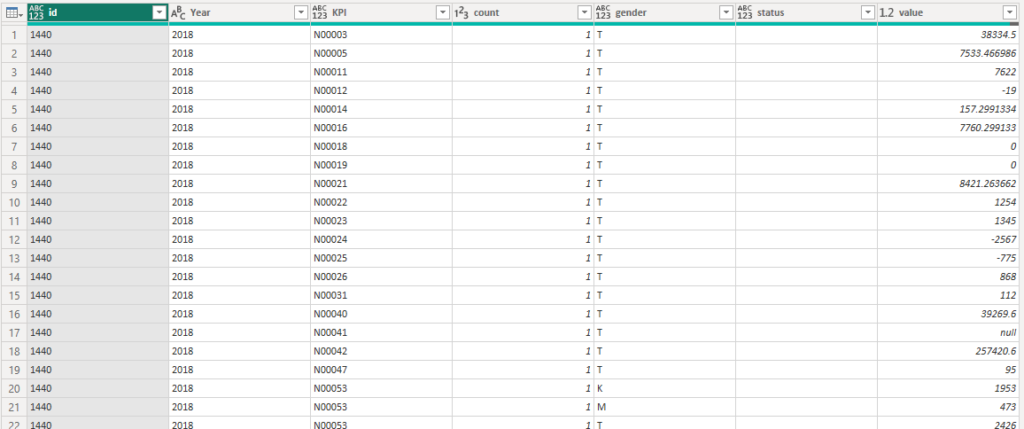
SourceNow I just invoke this function as a new column to fetch the KPI Values like this:
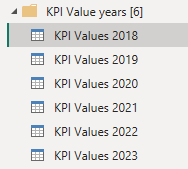
OK so this was option one. I considered it but decided to skip it because using this method, Power BI would only have 1 query to run the function and each record would have to wait for the previous one to complete. The solution I’ve went with is instead to create 6 references to the municipality table and on each of these instances I create a new Year column with only one year in it. Instead of having 290 municipalities times 6 years (1 740) in one query I end up with 6 queries with 290 records each.
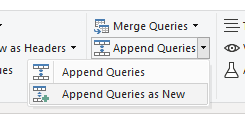
At the end I just append them all into one table to use in the report.
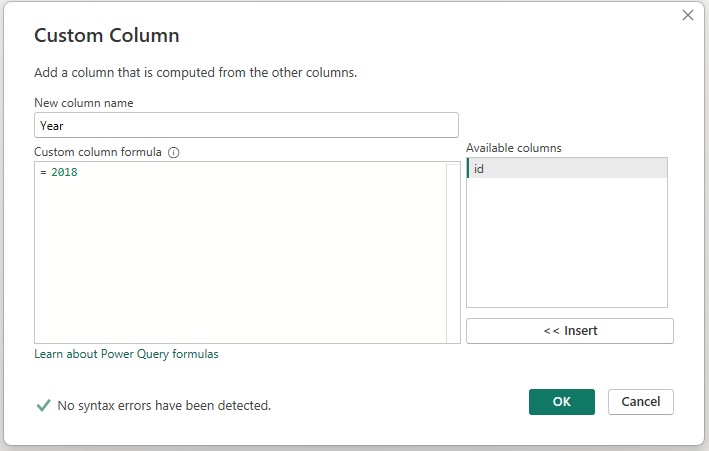
The custom column I add now looks like this:
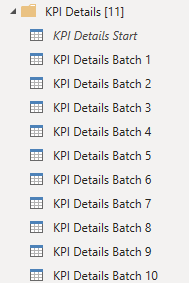
I end up with 6 queries like this:
And using the Append as new creates a fresh new table with all the values combined again!
OK next step was to use another function to fetch even more information! You see I now only had the actual values for each municipality and KPI but I didn’t have any more than the name of the KPI. Some context would be nice!
Now for some context, 5 municipalities and 6 years gives around 200 000 records with values across just above 5 000 unique KPI’s.
I wanted to create a new column with more data for each KPI but I wanted parallel runs just like above. To solve this, I needed to generate batches! Here’s how I did it!
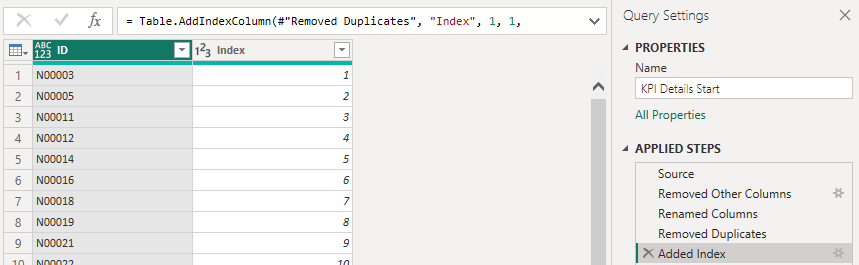
Step 1 is to reference the KPI Values table, remove all other columns than the KPI name, remove duplicates and finally add an index column.
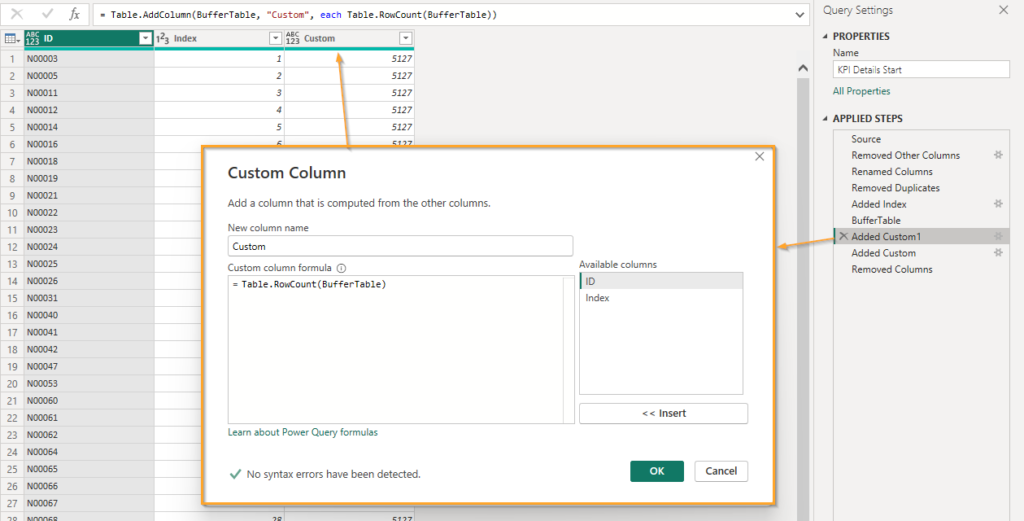
Next I decided to buffer the table into memory. Not sure if this is helping or making things slower to be honest but it felt good at the moment so I went with it. Feel free to test this yourself.
After that, I added a new column that containted the number of rows in the table, essentially giving me the highest value from the Index column!
I wanted 10 batches so I made this formula for my next custom added column!
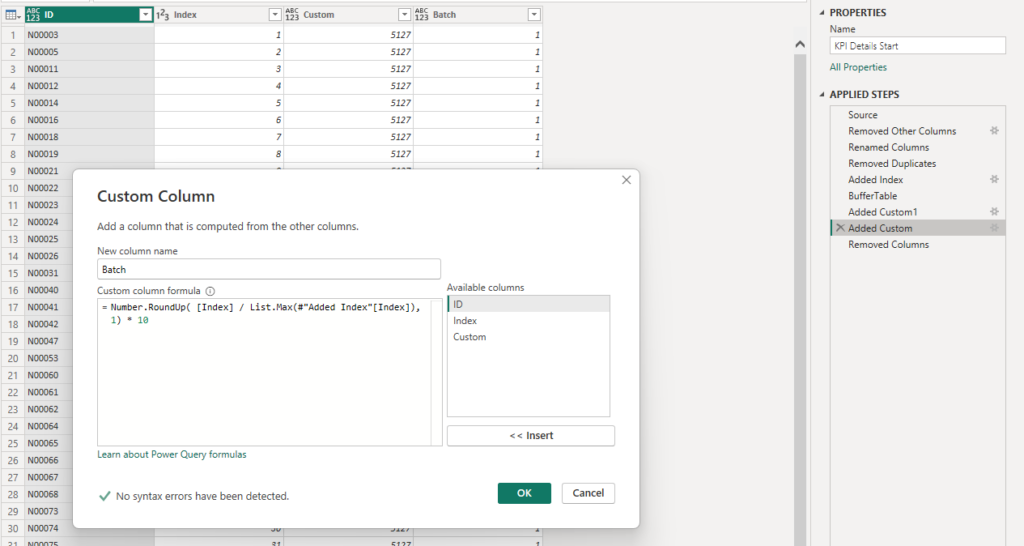
The formula will divide the index value with the maximum value, round it up to 1 decimal and finally multiply the number by 10 (to make it look prettier).
For example on Row 793: 793 / 5127 = 0.1546 rounded up to 1 decimal i 0.2 times 10 is 2. Row 793 goes into batch 2!
The beauty of the solution is that it will create the batches from % of the whole so if I only had 1 300 rows in the table, then Row 793 would be in batch 7 instead of 2. The number of batches remains at 10 and each batch except the last one will be equally large.
With this ready it was time to create more queries again! This time I made 10 references and each would begin by filtering one of the batches before running the function on the records within!
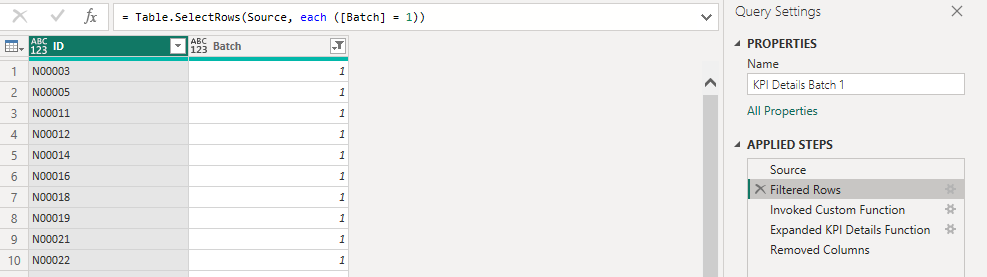
The queries looks like this:
This is the function:
let
    Source = (#"KPI ID" as text) => let
        Source = Json.Document(Web.Contents("http://api.kolada.se/v2/kpi?id="& #"KPI ID" & "&per_page=1")),
        values = Source[values],
        #"Converted to Table" = Table.FromList(values, Splitter.SplitByNothing(), null, null, ExtraValues.Error),
        #"Expanded Column1" = Table.ExpandRecordColumn(#"Converted to Table", "Column1", {"auspices", "description", "has_ou_data", "is_divided_by_gender", "operating_area", "ou_publication_date", "perspective", "prel_publication_date", "publ_period", "publication_date", "title"}, {"auspices", "description", "has_ou_data", "is_divided_by_gender", "operating_area", "ou_publication_date", "perspective", "prel_publication_date", "publ_period", "publication_date", "title"})
    in
        #"Expanded Column1"
in
    Source
In the end I used the same append as new table as before!
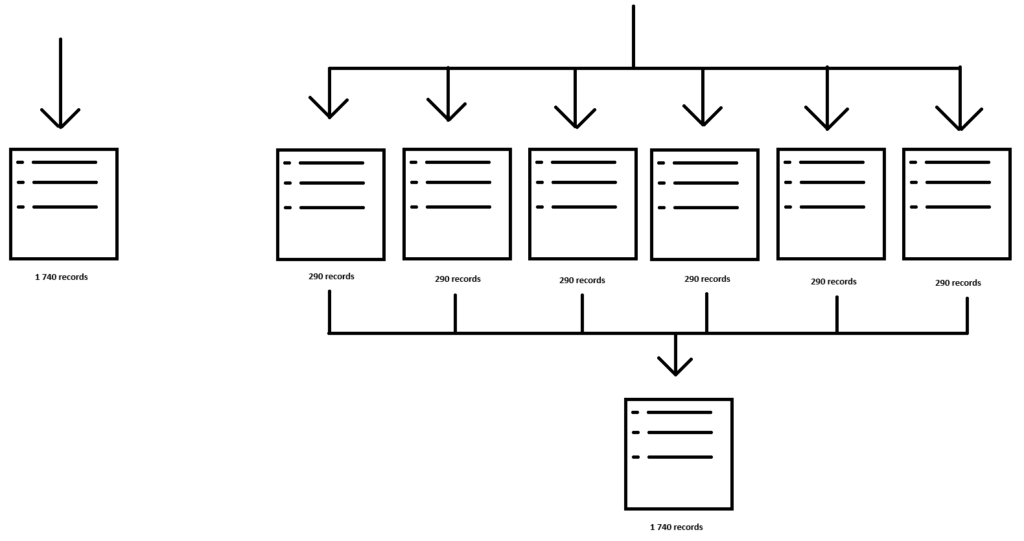
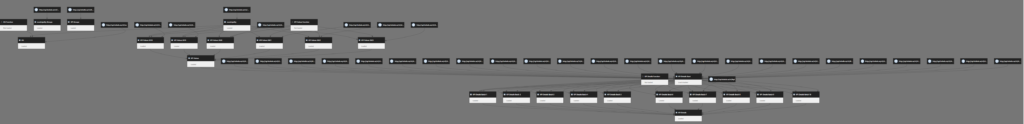
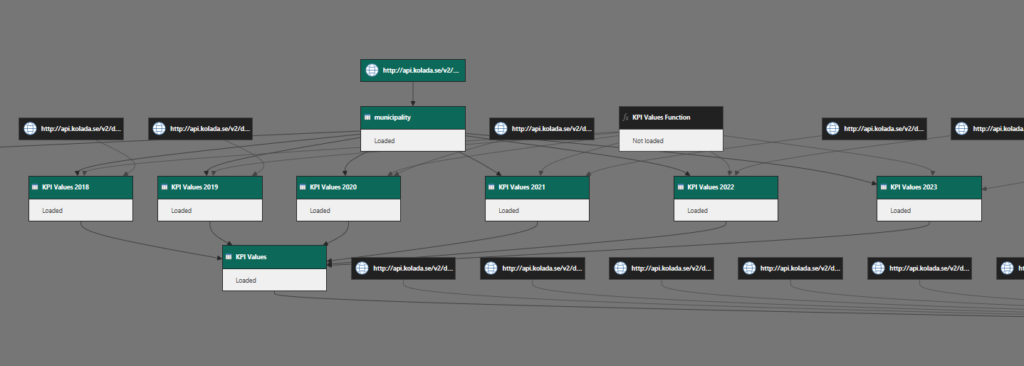
The query decencies view looks something like this now!
Zooming in we see the municipality table we begin with referenced into 6 tables with Years added to each and then merged back into one table again.
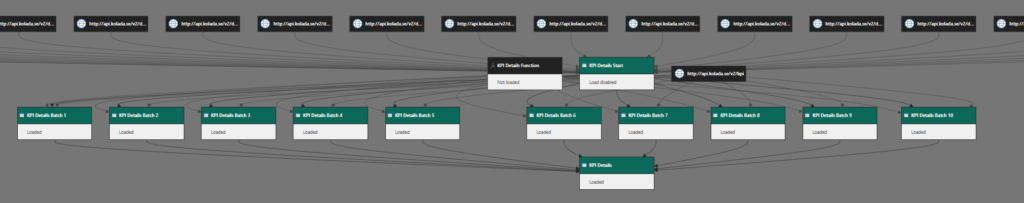
The values table is then referenced as the start for the details, split into 10 batches and finally merged back into 1 table again.
Any last words?
Well yes. While this was very insightful and I learned a lot by tinkering with it, by the end of the day I will most likely scrap most of this solution and simply download a big archive of JSON files with all the old values before releasing some open source Power BI Project on Kolada. It makes very little sense that each report should fetch millions of records from the API since the records will not be updated. Oh and since Power BI will through away any calculated data it already fetched when doing a new refresh it makes even less sense.
It’s kind of like I heard this study on running. It prolongs your life, yes, but most likely not by more time than you spend running so if you do this, you should enjoy running!
Even though this is not the final solution I wanted to share some of my progress and you can be very sure that I like to tinker with Power BI this way even if it doesn’t end up in the final solution! Hope you too have learned something new today!
Cheers!