Using Power BI for your Spotify data
I like to consider myself a good listener. To music, that is.
Spotify is almost always on regardless if I’m working, driving, cooking or working out. I recently figured there must be a ton of data that Spotify has collected for me! I mean, they do come up with recommendations weekly, I get yearly playlists of favorite tracks etc. Said and done, I logged on to https://www.spotify.com/se/account/privacy/ and simply asked for this data. Soon after I was able to download a zip file with JSON-files consisting of all my beautiful data! This means that you can do exactly the same for your own precious data and as it happens, I’ve put the Power BI Report here on Github so that you can make the very same insights as I have done. I’ll start by the insights I’ve gotten and at the end of the blogpost are instructions for how you can set this up for yourself!
Not convinced? Try it out for yourself here!
Overview
First things first; the overview! I’ve made this out of call out values almost entirely. It gives you an idea of what the report holds in store.

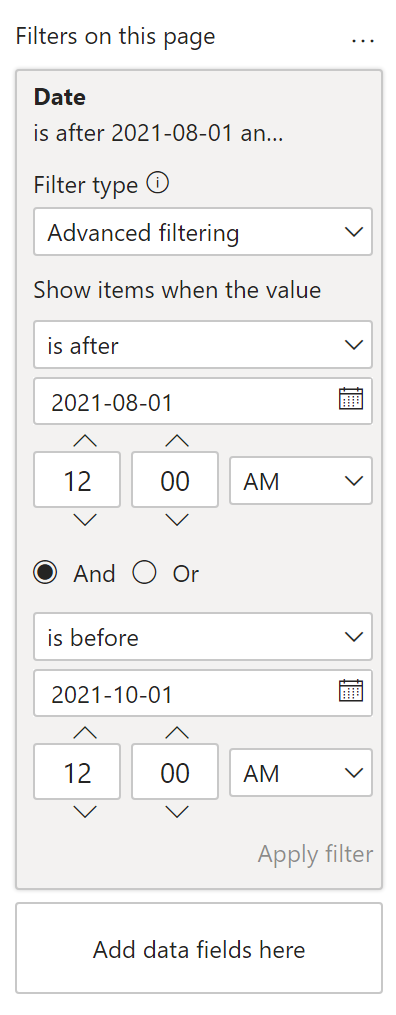
Playlists are as they are, but there’s a filter to work with the Streaming data. I might for example want to look at a certain period like this (and you can to):
This changes the overview and you get a new top list for the specified period!

Playlist
Page number 2 is considering the details of your playlists. I have 28 of them. There are 3 510 tracks in total in all of them, but only 2 945 distinct tracks. This means I have the same track in multiple playlists or sometimes even the same one. This number is splitted into 2 groups: the distinct tracks and the non distinct tracks. Essentially I have 2 493 tracks in playlists that only exists once in my entire Spotify library while 452 tracks appear at least twice.
On the left side I have my playlists, on the right side I have the tracks. These are of course searchable!

There are 2 ways you can use these tables to interact with each other. Click one or the other. Duh!
OK so I’ll lay it out for you. Click on a playlist and you’ll see duplicates in that playlist since the track list is sorted on most appearances on top. By selecting my “Ville”-playlist, I can see that there are a few tracks I’ve added multiple times in there.

Clicking a track will tell you which playlists it appears in. Sabatons Ghost Division is in 4 playlists but appears 5 times since it seems to have been added twice to my Ville-playlist.

Streaming history
The complete page looks like this. A bit messy perhaps but I just can help myself! There are so many interesting interactions you can make by selecting different things here and then you need other visualizations to react. Here, I’ll show you!

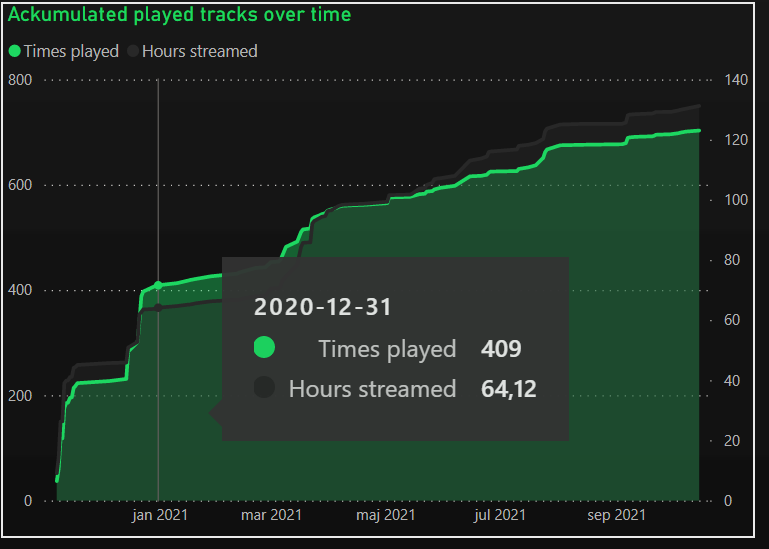
I’ve selected Equilibrium from the Artist-table. I now have a good overview of what appears to be my favorite songs by that artist based on the amount of times and hours I’ve spent streaming their tracks on the right side. I also get a graph telling me that I used to listen a lot on this artist during November and December in 2020 but not at all as much since. It also seems I’ve been listening on this artist all over the hour of the day, as can be seen down to the left.

By new years eve I had listened 409 times for over 64 hours. This can be seen by simply hovering over the graph like this:
By holding the CTRL key on your keyboard, you can select multiple choices from the same visualization or from different ones. Like this! I’ve selected 21:00 on the diagram down in the left corner and at this hour for the artist Equilibrium I seem to have enjoyed the track Unbesiegt the most.

By selecting the track (and not hold the CTRL key) I can now dig into insights on that specific track. I seem to enjoy this track the most at 21:00. Who knew!

Weird Insight
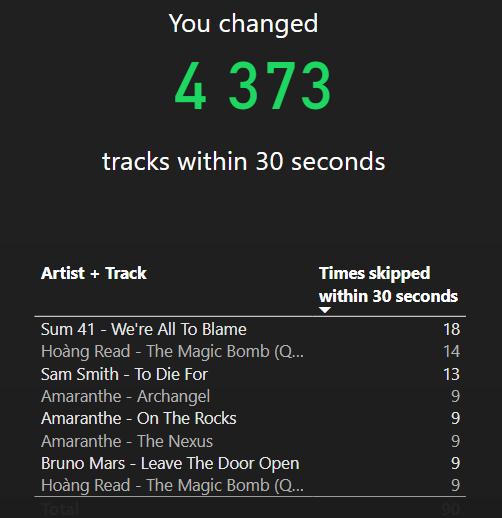
Raise your hand if you scrolled to this part. Who doesn’t love some weird insights? We’ll here it is! My weird insight looks like this and the page is divided into 4 parts. Tracks you’ve changed within 30 seconds, tracks you’ve listened to with more than 50 characters in the name, top tracks by week day and finally the amount of calories burned by listening to music!

We’re all to blame by Sum 41 is actually the first track of my Ville-playlist. Whenever I click play on that playlist I tend to go to the next track and just see where I end up in the shuffled que. The other once I can’t explain.
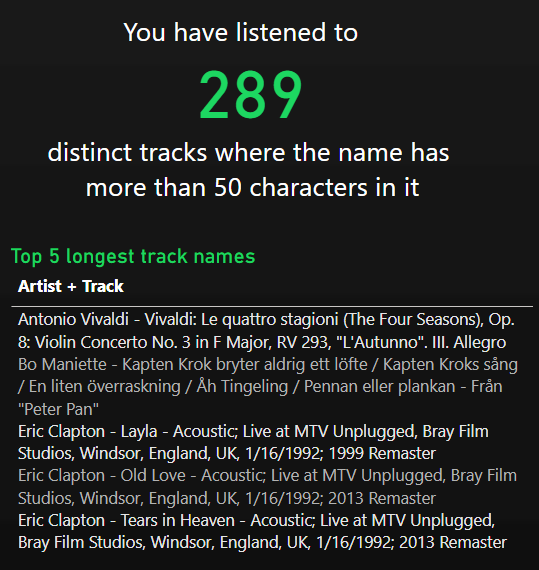
Not only have I listened to almost 300 distinct tracks with a name over 50 characters, there’s also a list of the top 5 tracks based on the longest track names from your streaming history.
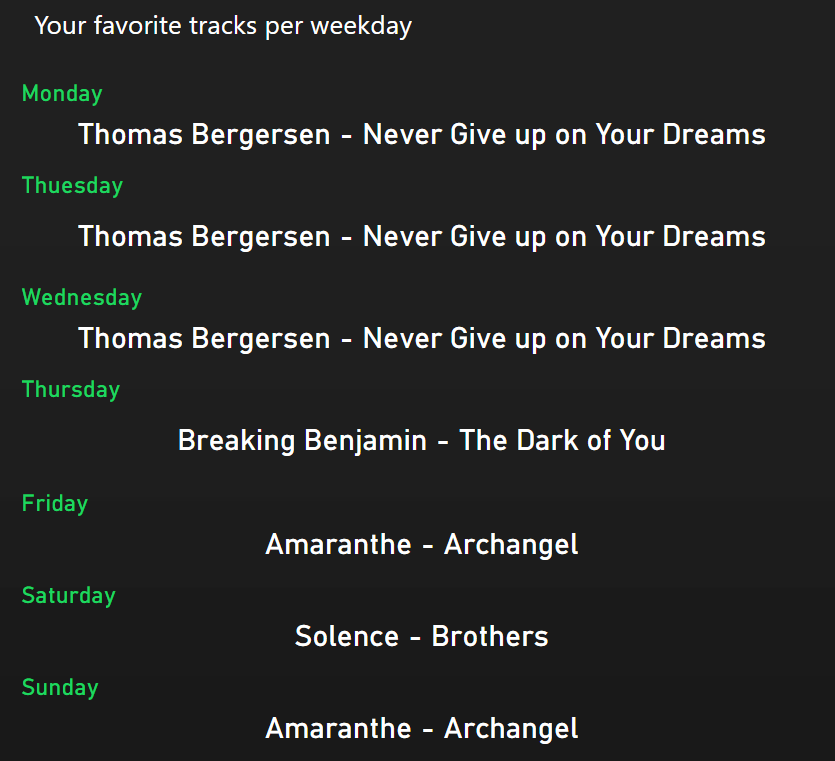
Over to week days! I usually listen to Thomas Bergersens Never Give up on your Dreams during work with noise cancelling headphones to keep disturbances and interferences at bay when I need to focus. I do this during train rides, in hotel rooms or at my home office when I need to go into focus mode! It makes sense it’s on my top list for at least a few workdays. The dark of you by breaking benjamin, Archangel by Amaranthe and Brothers by Solence are excellent tracks to give me energy when doing chores at home or when I’m building stuff. Would recommend.
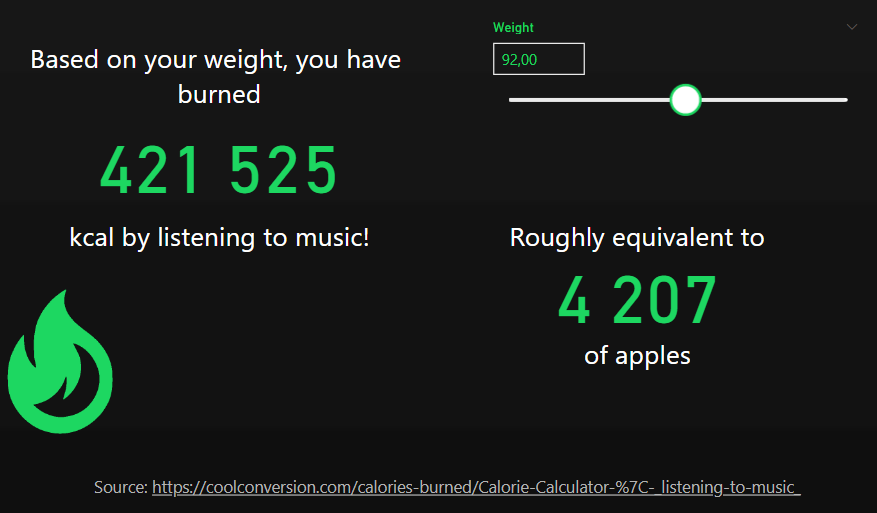
Finally I’ve discovered a calculator that tells you how many calories you burn by translating sounds in your brain, i.e. listening to music! I simply copied the formula and added a What-If-Parameter to the report so that you can enter your weight using a slider. Based on your weight and amount of streamed hours of music, you can see how much calories you’ve burned! Pretty neat huh? A good measurement here is to keep the apple-counter above 365. An apple a day keeps the doctor away, they say and in order to not gain weight, you can cancel it out by listening to your favorite songs. This is my kind of workout!
This page is also filterable by date, of course! Since 1 of September, this is what my data looks like.

How to set this up with your own data?
Download the report from https://github.com/villezekeviking/GiveAways/blob/main/Spotify%20Report.pbit
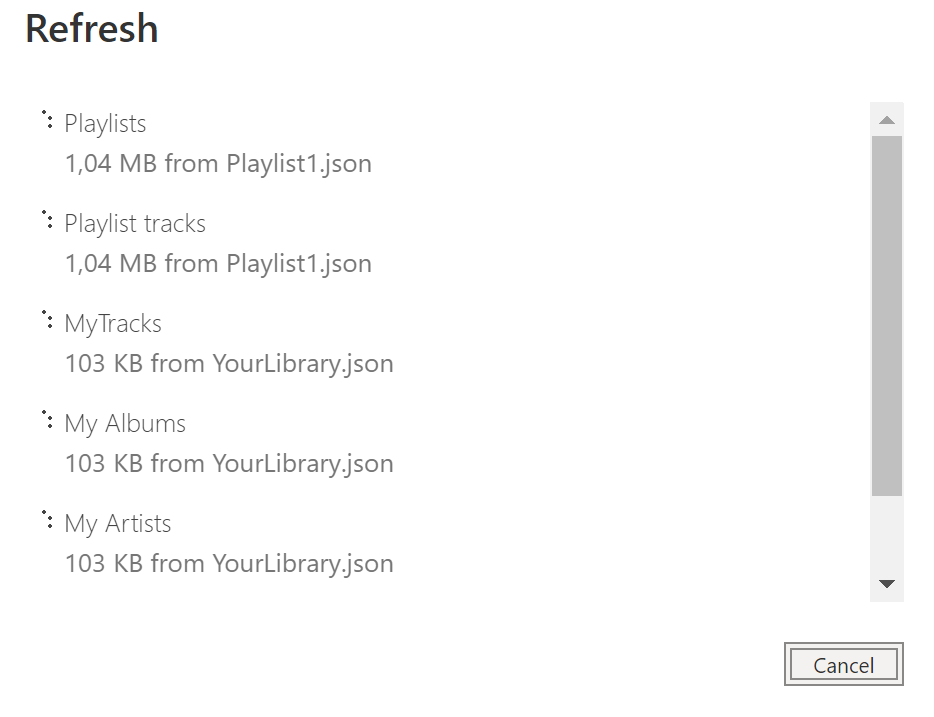
Download your Spotify data and unpack the .ZIP file anywhere you like. Copy the search path to that folder.
Open the file in Power BI desktop that you can install from Microsoft Store
In the window from Power BI, keep the Sample file as is and fill in the search path for your Spotify data, ending with a /

Sit back and relax while Power BI does some work for you
That’s all! You’re now up and running! Feel free to make any improvements you like. If you make any funny insights, feel free to share them with me or give me some feedback.
Cheers!
The last file Streaminghistory doesn’t work with my entered path. Probably forgotten to parameterized that one. Send my an email and I can send you the error messages.
I can fix it on my side but maybe you want to fix it.
Thanks for pointing that out! I’ve fixed it and uploaded a new version to github!