Power BI, Excel and Visio walks into a bar…
They all hit their heads on said bar. After that they sat down to talk.

Excel bragged about the cool things it could do. “Behold, as I goal seek certain input for a desired output” he said. He headed into the Data tab and selected Goal seek.
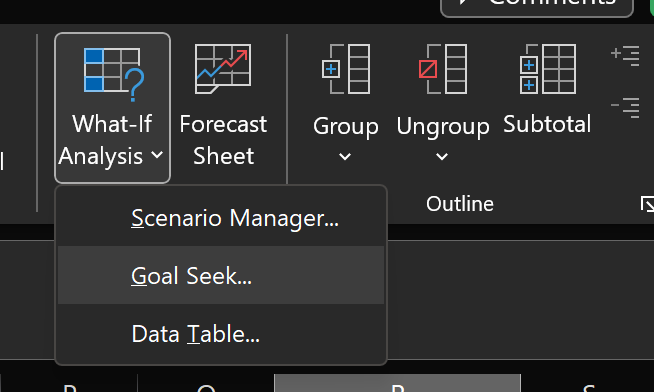
With the power of goal seek, Excel could select a calculated output, no matter how deep through layers of calculations they are and even when said calculations authors logic has long been forgotten.
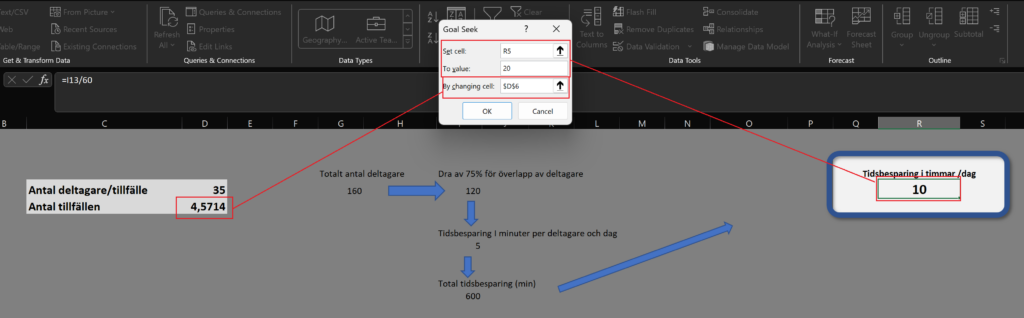
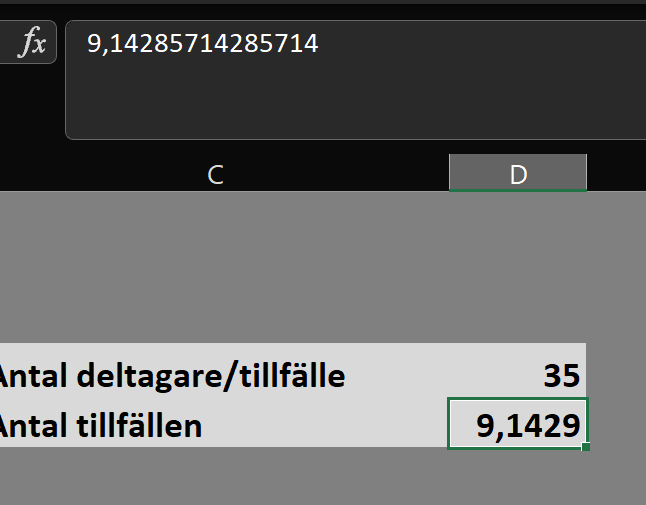
Some might argue that Excel is even a bit over ambitious in terms of the granularity here.
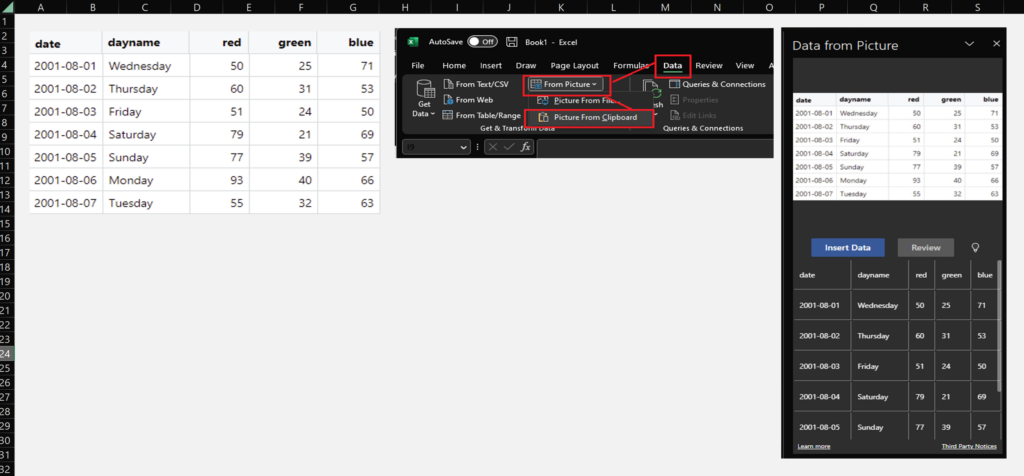
“You think that’s cool?”, Excel proclaimed. “I also have the power of AI vested in me” he said as he snapped a print screen (Win + Shift + S) of a table of data and with nothing more than this flat image, he turned it into a functioning table using “Get data from picture”. Power BI mentioned that this is indeed a useful skill and could be used to create data for datasets.
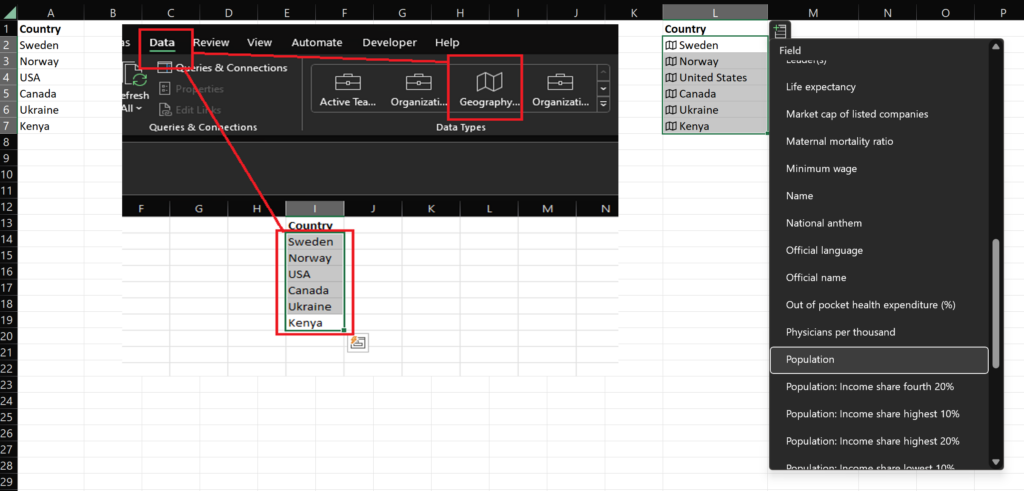
Visio and Power BI where indeed impressed as Excel went even further by claiming he had vast knowledge beneath the surface of what might look like simple data. He wen on to write down a couple of country names in a few cells, selected them and went back to the data tab where he simply announced these cells to be of the Geographical type. The others witness how Excel could magically add meta data from thin air!
At this stage, Power BI concluded she would not be fooled by this claimed “Magic”. Not only did Power BI know how the trick was preformed, she also knew how to provide Excel with the needed input for it to work with any kind of data!
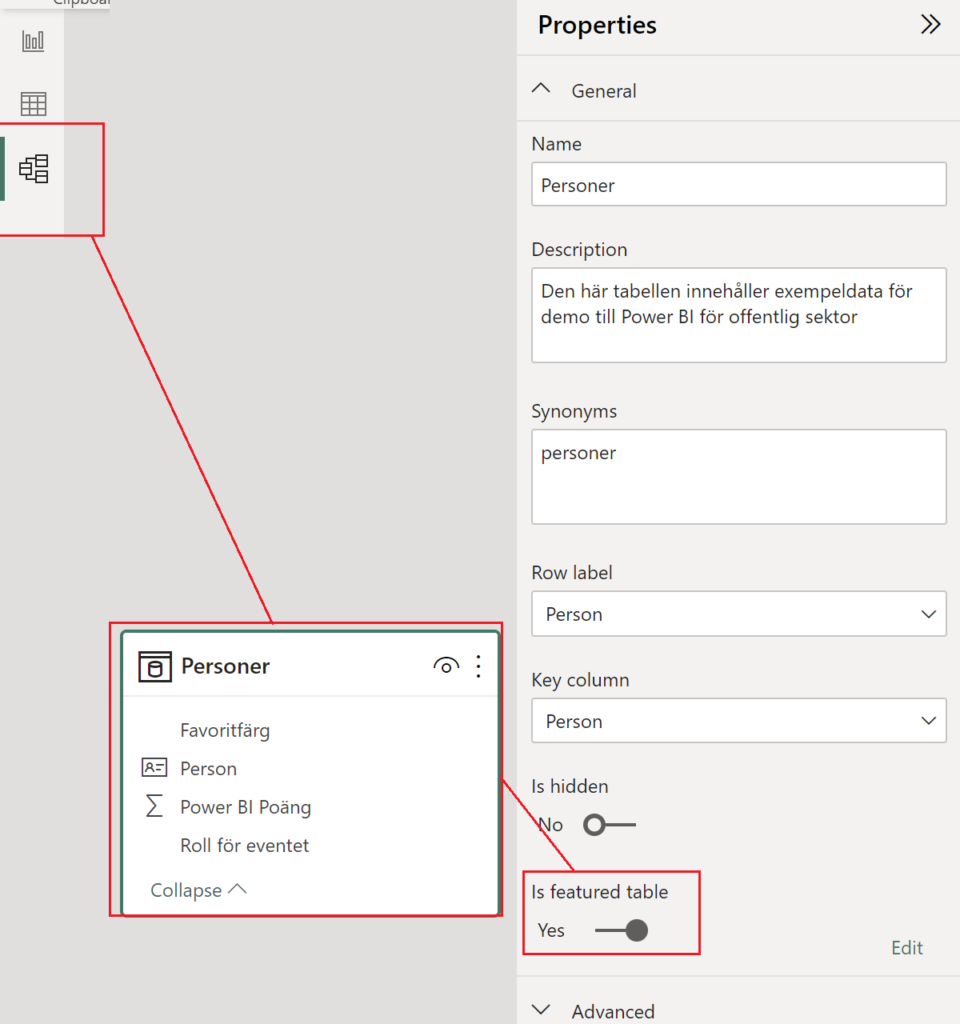
She fired up a report in Power BI desktop, went to the model tab on the left side of the screen, selected a table and ordered it to be “featured table”.
She then published the report to a workspace that she knew Excel had access to and asked Excel to head back into the data type field. Indeed, the new table was now selectable in there and Excel could now magically add meta data from a list of people as long as their names matched a name in the Power BI dataset.
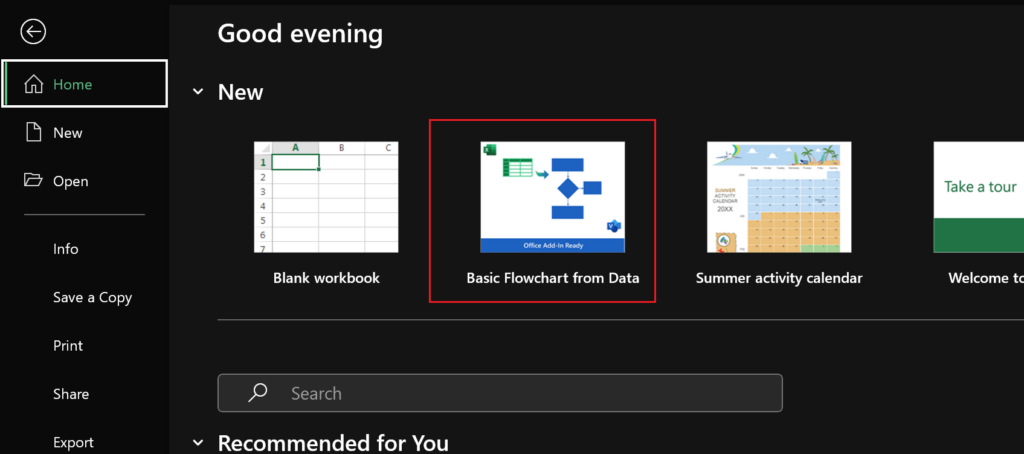
Now Visio wanted in on the bragging contest and stated he was able to create beautiful flow charts by simply dragging and dropping objects. Before the sentence could be finished, Excel would interrupt to explain how he could command Visio to build these flow charts from a template. Excel showed how there is actually a template to create Visio flow charts built into Excel, selectable when creating a new Excel workbook.
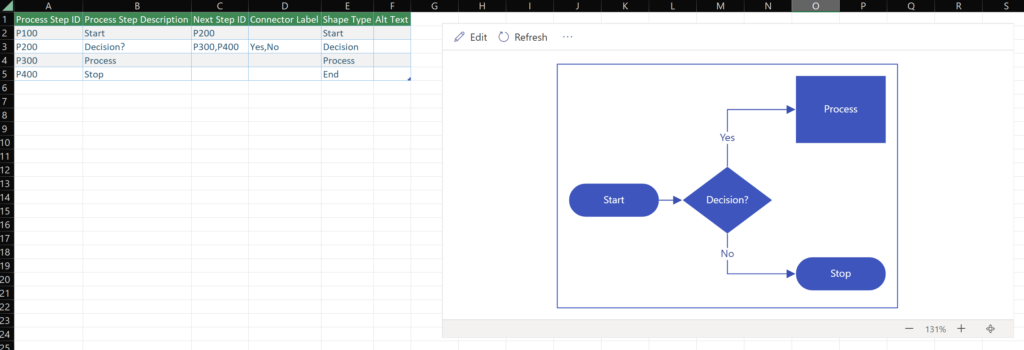
Excel made a simple flow chart table and Visio read the instructions instantly, even creating a preview right in Excel to see the result! Visio saved this flow chart in SharePoint Online.
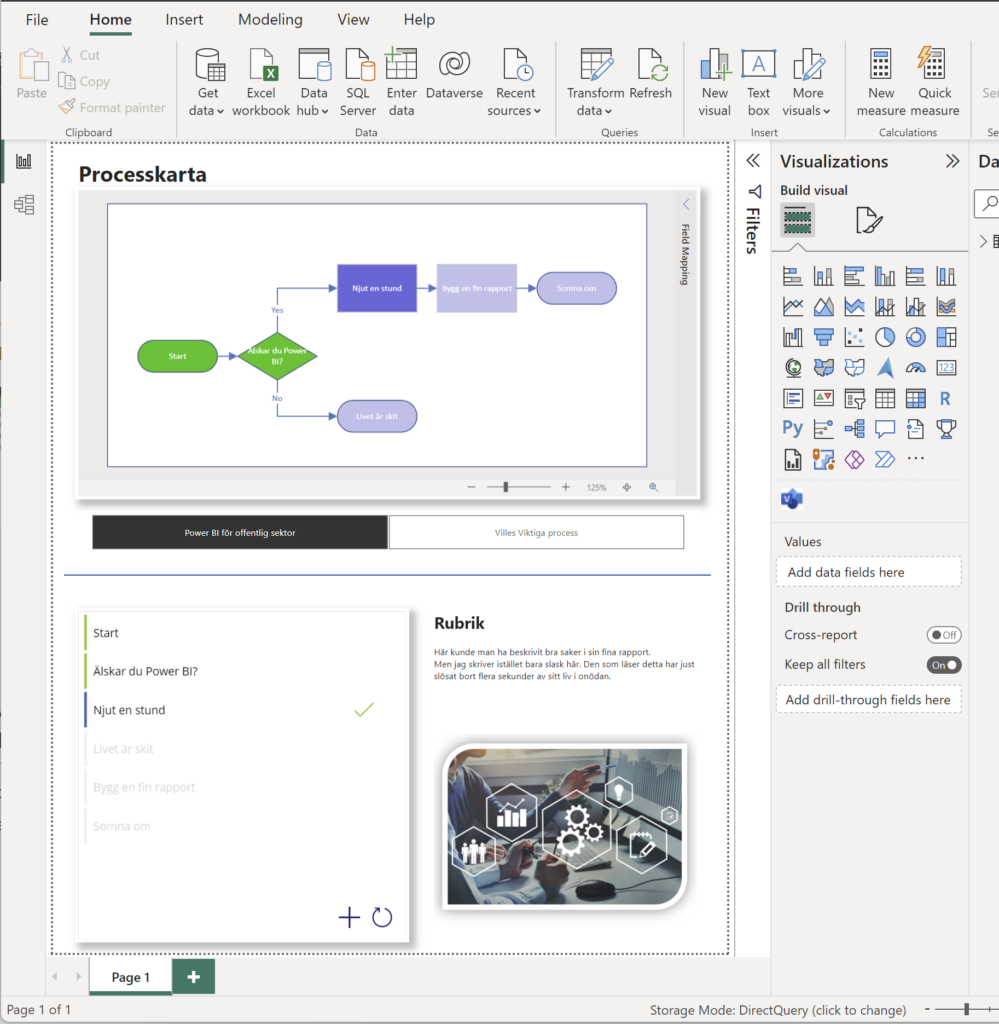
Power BI now jumped back in the conversation and explained how she too could make use of this! The table from Excel could be read to a dataset and in Power BI, there is a Visio visual ready to be used!
Excel added a status column to the table that Power BI could use to highlight the objects in the Visio chart differently.
Power BI phoned up her friend PowerApps and asked for a simple app that could be embedded into the Power BI report and that could patch the Excel table with new statuses so that steps could be “cleared”.
Excel, Visio, PowerApps, SharePoint and Power BI stopped their bragging for a few seconds and stood quietly, observing the beauty they’ve just created by working together.
A truly wonderful ending to the story, as the products came to the conclusion that even though they have awesome abilities alone, they could multiply that awesomeness by combining their powers and work together.
And with that, the story of Power BI, Excel and Visio walking into a bar is concluded. If you’d wish to look at the Excel file used in this story, you can download it from github here.
Should you desire more information on the functions mentioned in the post, please refer to these links or feel free to reach out to me on LinkedIn!
https://learn.microsoft.com/en-us/power-bi/collaborate-share/service-create-excel-featured-tables
https://learn.microsoft.com/en-us/power-apps/maker/canvas-apps/powerapps-custom-visual
Cheers!