DAX Tables – Calendar and Time
As time travelling is yet to be invented, the dimension of time tends to be rather crucial in most reporting scenarios. I can only imagine the implications time travels will have on the BI business!
“As you can see the trend is going upwards! This is great!”
“Yesterday I showed you how the trend is going upwards but due to time travelers altering the history, the trend is now going downwards”
“The service desk reporting shows that we take an average of 10 hours to handle Password resets. This is unacceptable! I suggest 2 agents shall travel back in time and reset the password for the 10 cases with the longest handling time at the very same time as the password reset was requested, thus greatly reducing our average handling time”
“What was the result of last years bookings? 7% margin?! Oh no! What was our lowest month in terms of revenue? Let’s discuss how we can try that month again for a better outcome, shall we”
Anyhow, let’s not dwell on the future and instead focus on the present, where the time dimension is often needed in Power BI reporting. If you find your self in need, feel free to copy this sample to get your calendar and/or time tables for your reports 🙂
I gift upon you three DAX tables as above! They can be copied from below as DAX code or you can download the sample report from Github here!
Calendar
When you need dates and some meta data for said date, this is your go to place! Sure, there’s a hierarchy built for you by default for year, quarter, Month and day but sometimes you want to make relations to other tables and they only have for example the year. In any case, it’s quicker to delete something than to create it so use this as a starting point.
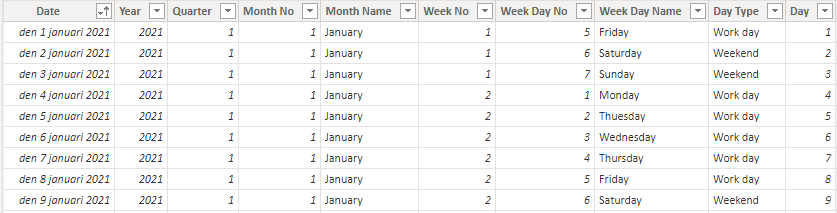
The first 15 rows of the DAX Table is looks like this. You have 3 options. Set a manual start and end date for your table (or use formulas) or simply use the CalendarAuto-function. Both will work and both will create the entire table with all the meta data for you. You can also set another Locale.
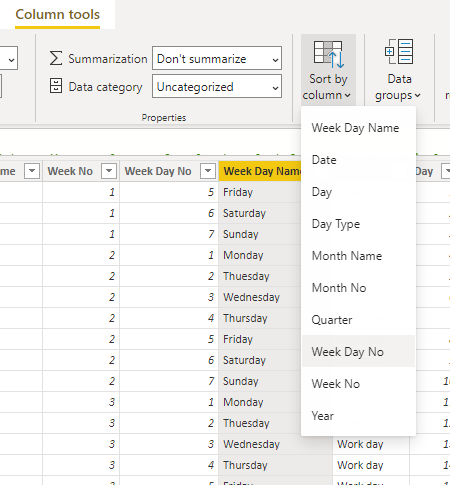
After this row, the table is created for you like this. Note that I’ve set the return type of Week No to 21 and Week day to 2 at row 42 and 44. This means that new weeks to begin on Mondays. Feel free to change this if your have other preferences.
Remember to set week day name to be sorted on week day No after creation, this way you will get the week days in the correct order instead of alphabetically.
The full query can be copied here:
Calendar =
// If you wish to set manual dates, do it here. You can also use formulas to select for example the minimal value of a column in the report
VAR StartDate = "2023-01-01"
VAR EndDate = "2023-12-31"
// Set the language you wish the DAX code to use when creating names on weeks, months etc.
VAR Locale = "Sv-Se"
// Uncomment the option you wish below. Comment out the other option
// Calendar will use the start and end date above
// CalendarAuto will automatically find the earliest and latest date in the model
VAR CalendarTable =
// CALENDAR(DATEVALUE(StartDate),DATEVALUE(EndDate))
CALENDARAUTO()
Return
SELECTCOLUMNS(CalendarTable,
"Date",
[Date],
"Year",
YEAR([Date]),
"Quarter",
QUARTER([Date]),
"Month No",
MONTH([Date]),
"Month Name",
UPPER(
LEFT(
FORMAT([Date],"MMMM",Locale),
1
)
)&
MID(
FORMAT([Date],"MMMM",Locale),
2,
20
),
"Day",
DAY([Date]),
"Week No",
WEEKNUM([Date],21),
"Week Day No",
WEEKDAY([Date],2),
"Week Day Name",
UPPER(
LEFT(
FORMAT([Date],"DDDD",Locale),
1
)
)&
MID(
FORMAT([Date],"DDDD",Locale),
2,
20
),
"Day Type",
IF(
WEEKDAY([Date],2) > 5,
"Weekend",
"Work day"
),
"Years Offset from today",
YEAR([Date]) - YEAR(TODAY()),
"Quarters Offset from today",
(
QUARTER([Date]) - QUARTER(TODAY())
)
+
(
YEAR([Date]) - YEAR(TODAY())
) * 4,
"Months Offset from today",
(
MONTH([Date]) - MONTH(TODAY())
)
+
(
YEAR([Date]) - YEAR(TODAY())
) * 12,
"Weeks Offset from today",
(
WEEKNUM([Date],21) - WEEKNUM(TODAY(),21)
)
+
(
YEAR([Date]) - YEAR(TODAY())
) * 52,
"Days Offset from today",
FORMAT([Date],"00") - FORMAT(TODAY(),"00")
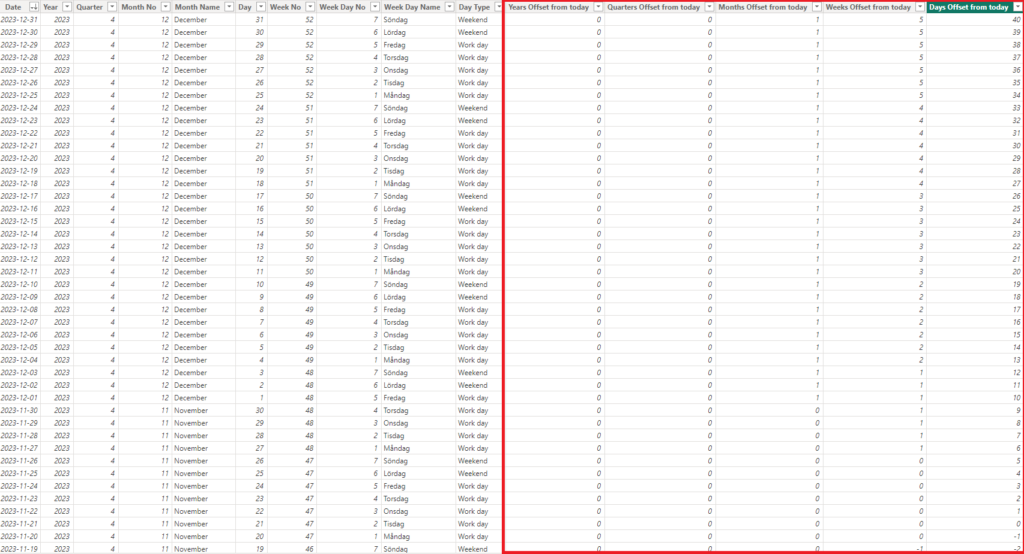
) The Offset-columns can be used to filter dates from today. You can select years, quarters, months, weeks or days from today. 0 means the current one. Positive values means future dates and negative values means they’re in the past.
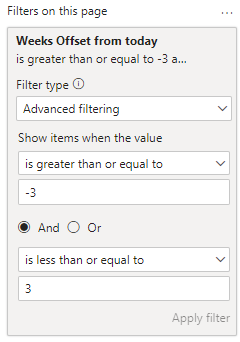
You can use these anywhere in the report to slice relative to the current date. For example, putting this into the Filter on this Page will make sure only data between last 3 weeks up until next 3 weeks will be shown. This is great for rolling averages!
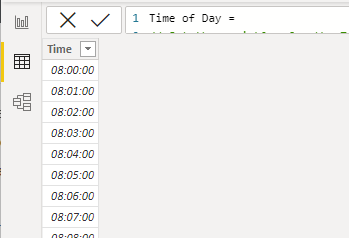
Time of Day
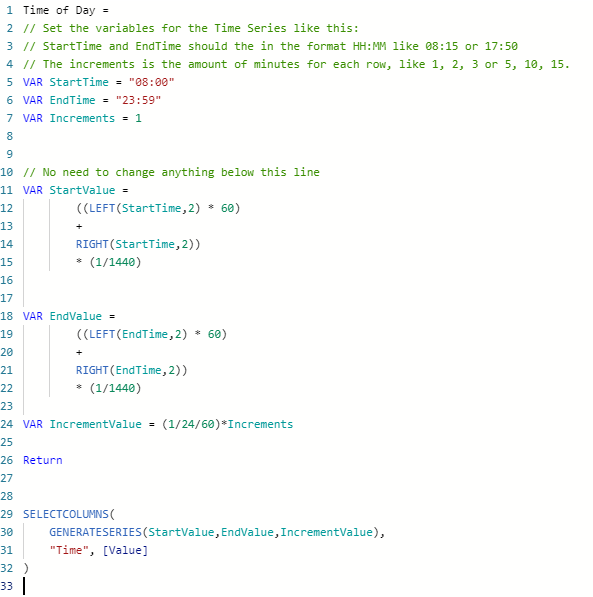
The second table is the Time of Day. I’ve made 2 tables for you to choose from here. The first one will only create 1 column and it’s customizable to your preferences. If you for example know that you’ll be needing 10 minutes increments from 08:00 to 18:00, the table will not create any other unnecessary rows for you.
You set the starttime, the end time and finally the increments on row 5, 6 and 7.
This creates the table like so:
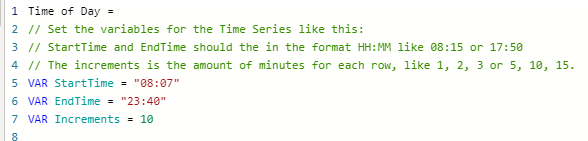
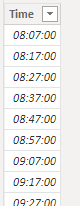
By changing the variables at the top you can get a completely different table:
This table is useful if you don want any extra columns that you wont be using anyway. You know what you want and just want that. Simple! The code can be found here:
Time of Day =
// Set the variables for the Time Series like this:
// StartTime and EndTime should the in the format HH:MM like 08:15 or 17:50
// The increments is the amount of minutes for each row, like 1, 2, 3 or 5, 10, 15.
VAR StartTime = "08:07"
VAR EndTime = "23:40"
VAR Increments = 10


// No need to change anything below this line
VAR StartValue =
        ((LEFT(StartTime,2) * 60)
        +
        RIGHT(StartTime,2))
        * (1/1440)


VAR EndValue =
        ((LEFT(EndTime,2) * 60)
        +
        RIGHT(EndTime,2))
        * (1/1440)

VAR IncrementValue = (1/24/60)*Increments

Return


SELECTCOLUMNS(
    GENERATESERIES(StartValue,EndValue,IncrementValue),
    "Time", [Value]
)
Time of Day (Full)
This table gives you a row for every minute of the day from midnight to midnight! It then, just like the calendar, gives you more data per row to play with. This table could also be a substitute for the Group function where Power BI can bin a value. If you only need to group 1 column it might be faster to do it that way, if you want to bin multiple time columns from different tables it’s probably faster to simply relate them to this time table instead.
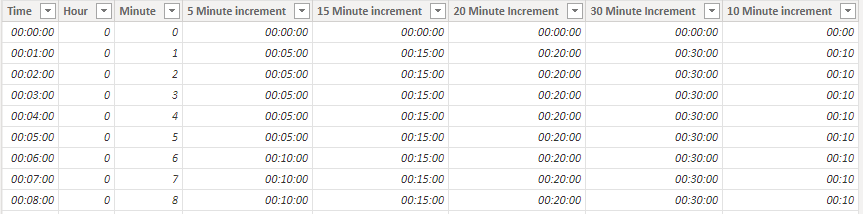
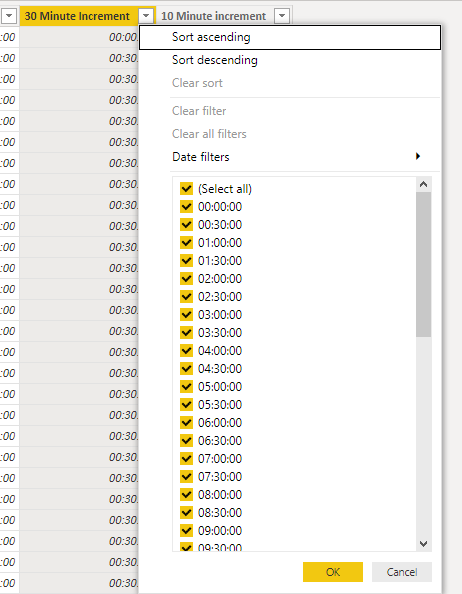
This is a sample of how the 30 minutes increments looks like. Remember that you can stack these columns so that the user can actually decide on the granularity in the report themselves!
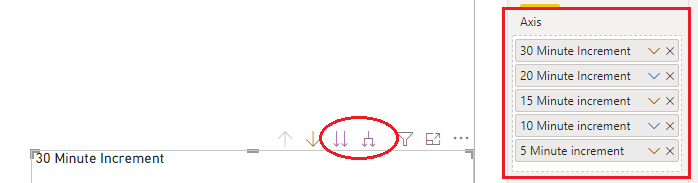
By using the left arrows, the user can step down in the hierarki and decide if they want to see the data in 30 minutes intervalls down to 5 minutes intervalls. Well actually if you simply include the Time-column you can drill down to just 1 minute intervalls too!
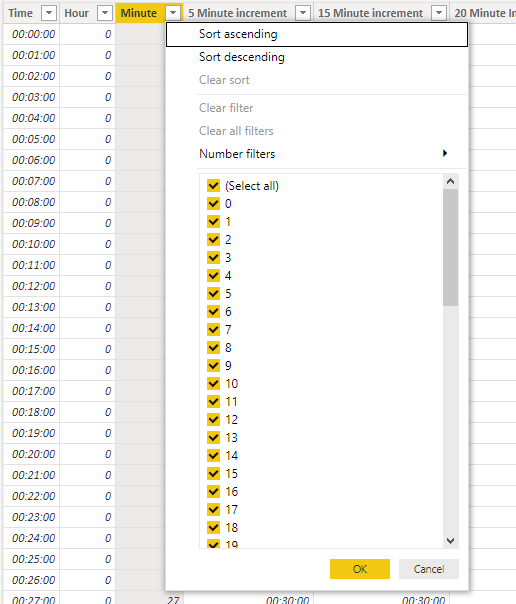
Speaking of 1 minute intervalls, sometimes you want that without the hour dimension. Using this column you can look into differences of how trends appear during any hour of the day. I would for example bet that you express a certain behavior for meetings that can be tracked like this. At 45 minutes, you probably usually look at your phone to determine what next meeting is about to start and what you were about to prepare. In the offices I would bet that the amount of coffee cups produced by coffee machines have a great increase between 45-57 minutes as well as between minute 15-27. Using this vital insight you could plan your coffee gathering to low activity times of the hour, saving what I can only assume to be multiple seconds on a yearly basis. Seconds you just wasted reading a weird hypothesis on effective coffee collecting time of the hour. My bad.
Should this table be desirable in your Power BI arsenal, I present you with the DAX code below:
Time Of Day (Full) =
VAR MinuteTable = GENERATESERIES(0,1,1/1440)
Return

SELECTCOLUMNS(MinuteTable,
    "Time",[Value],
    "Hour",HOUR([Value]),
    "Minute",MINUTE([Value]),

    "5 Minute increment",
        VAR MinValue5 =
            ROUNDUP(
                DIVIDE(
                    MINUTE([Value]),
                    5,0
                ),
                0
            ) * 5
        Return
        IF(MinValue5 = 60,
            (1/24)*HOUR([Value]),
            (1/24)*HOUR([Value])+(1/1440)*MinValue5
        ),

    "10 Minute increment",
        VAR MinValue10 =
            ROUNDUP(
                DIVIDE(
                    MINUTE([Value]),
                    10,0
                ),
                0
            ) * 10
        Return
        IF(MinValue10 = 60,
            (1/24)*HOUR([Value]),
            (1/24)*HOUR([Value])+(1/1440)*MinValue10
        ),

    "15 Minute increment",
        VAR MinValue15 =
            ROUNDUP(
                DIVIDE(
                    MINUTE([Value]),
                    15,0
                ),
                0
            ) * 15
        Return
        IF(MinValue15 = 60,
            (1/24)*HOUR([Value]),
            (1/24)*HOUR([Value])+(1/1440)*MinValue15
        ),

    "20 Minute Increment",
        VAR MinValue20 =
            ROUNDUP(
                DIVIDE(
                    MINUTE([Value]),
                    20,0
                ),
                (1/24)*HOUR([Value])
            ) * 20
        Return
        IF(MinValue20 = 60,
            (1/24)*HOUR([Value]),
            (1/24)*HOUR([Value])+(1/1440)*MinValue20
        ),

    "30 Minute Increment",
        VAR MinValue30 =
            ROUNDUP(
                DIVIDE(
                    MINUTE([Value]),
                    30,0
                ),
                0
            ) * 30
        Return
        IF(MinValue30 = 60,
            (1/24)*HOUR([Value]),
            (1/24)*HOUR([Value])+(1/1440)*MinValue30
        )
)
And that was it for this time 🙂 As always, reach out if you have any questions, feedback or just want to say hi!
Cheers!