Nested SUMX for What-If scenarios in DAX
Did you get goose bumps reading that title? If so, I obligated to refer you to my psychiatrist as this is apparently not normal. If you, like me, don’t really care and still think it’s really cool and you want to find out more, read on!
In this blog post I’ll describe the solution to a scenario where a company wants to calculate bonuses for their sales staff based on monthly overperformances and how different threshold and bonus percentages will effect the outcome. First I’ll go through the result but if you scroll down, you find out exactly how it was made and how you can make this yourself!
The result
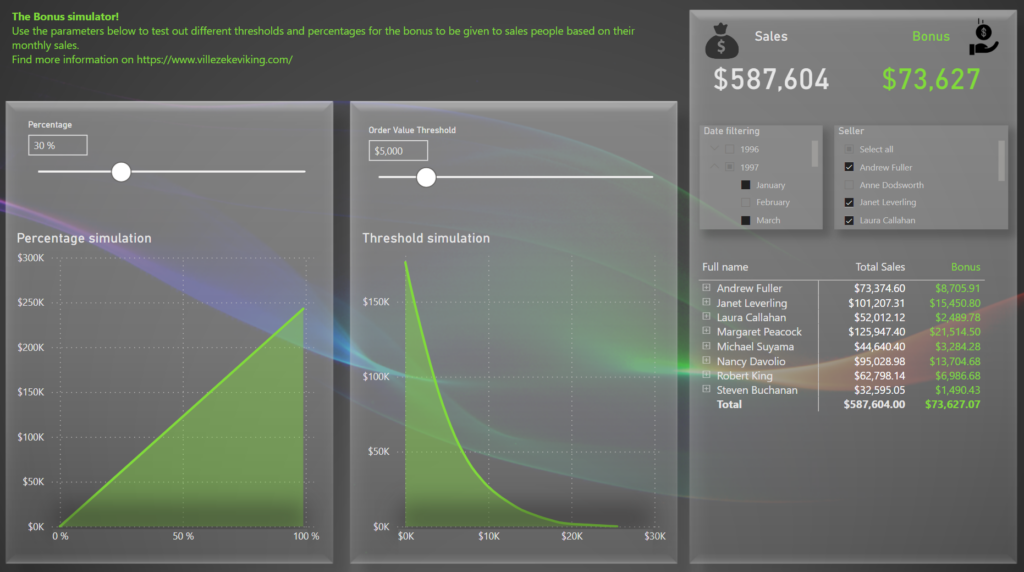
If you want to click around, you got the report published to the web here and downloadable from github here. The report overview looks like this!
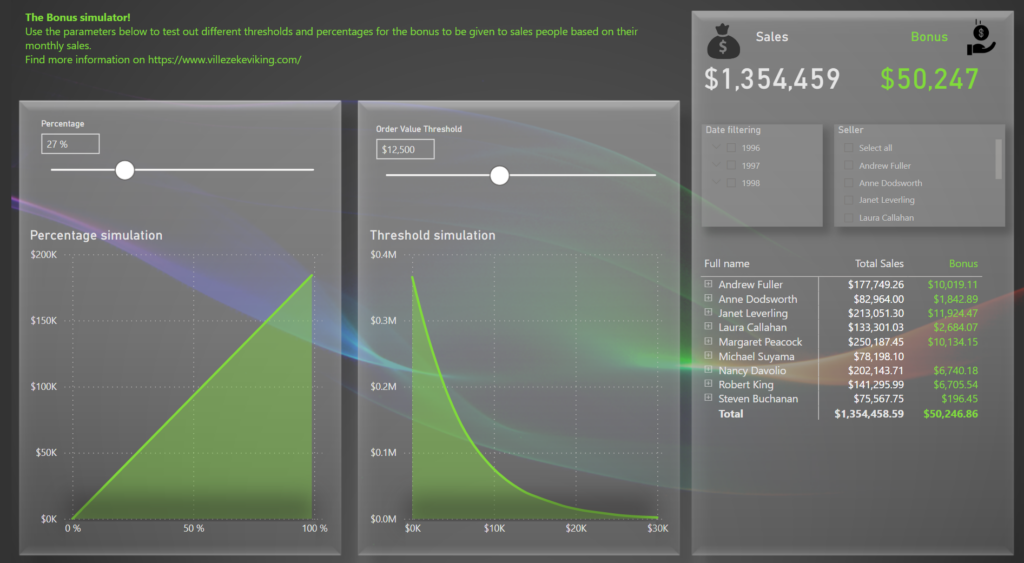
The idea of it is that you can use the sliders to decide a threshold per seller and month and for any amount above that threshold, a percentage will be paid out to the seller as a bonus. This could be useful in other scenarios as well, like with a consulting bonus calculation where a the consultant would get a percentage of any value billed above a certain threshold.
Let’s try it out with some examples! Here I’ve set the percentage to 10 and the Order value Threshold to 1 000.

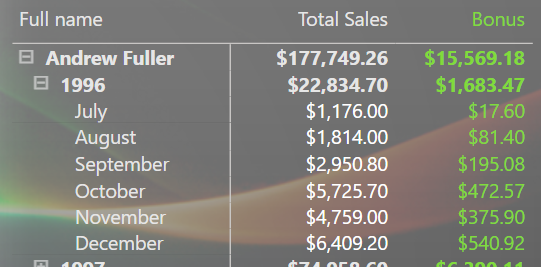
If we have a look at the detailed table, we can see that Andrew Fuller would have gotten a totalt bonus of 15 500+ dollars with this setup. Augusti 1996 he had a total sales value of 1 814 dollars. Our threshold is set to 1 000, meaning that 814 dollars exceeded our threshold. Out of that, he is given 10% as his bonus, meaning he got 81,4 dollars as a bonus in that month.
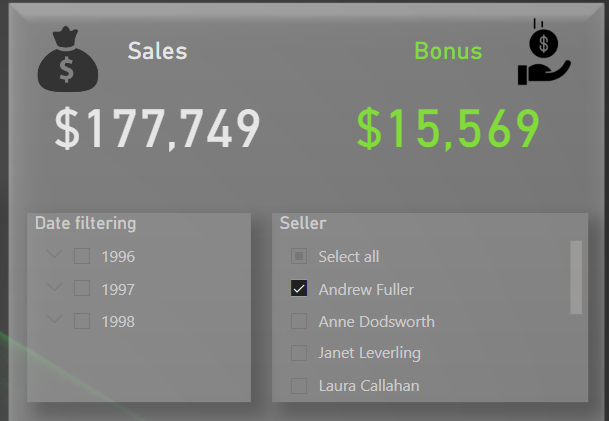
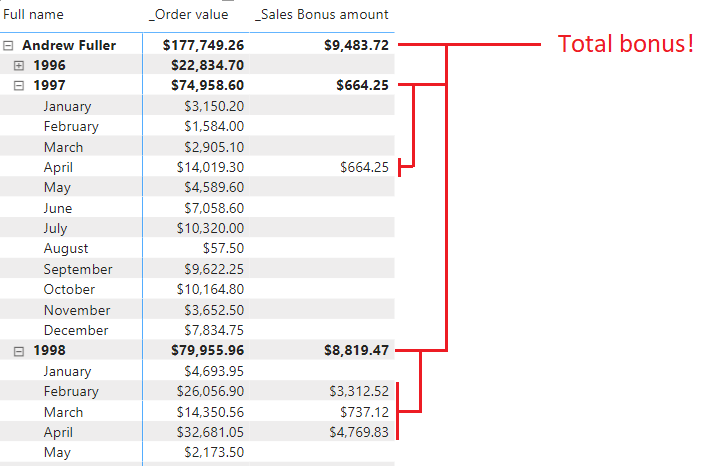
If I select Andrew in the filter, the report will now only show him. With this setting, let’s have a look at the simulated graphs!
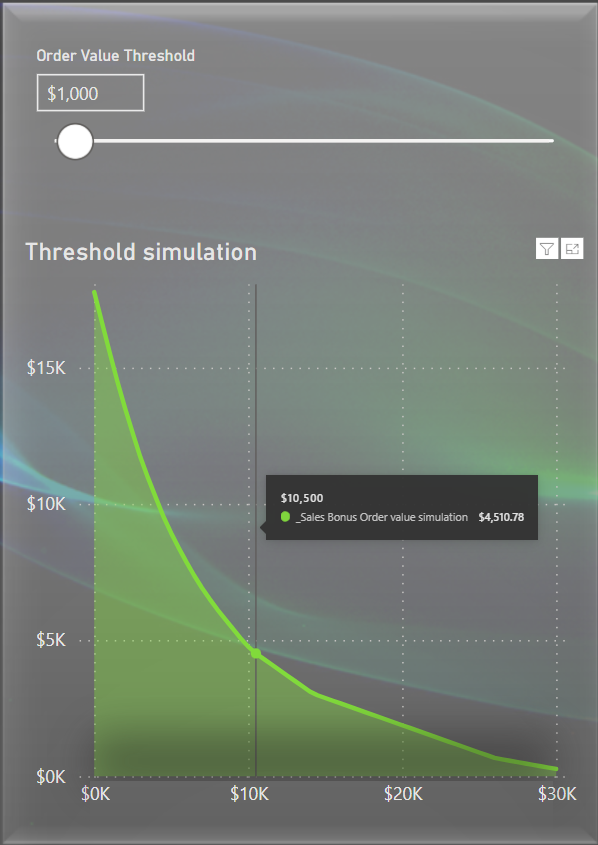
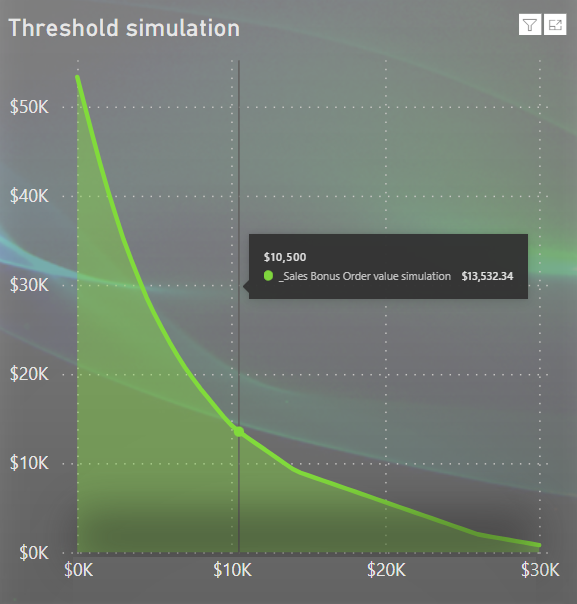
With the percentage set to 10%, meaning he would get 10% of everything he sold above the threshold per month, this graph shows how much the bonus would be for Andrew given different thresholds. If the threshold was 10 500, he would find himself with a bonus of about 4 510 dollars.
If I set the percentage to 30 instead of 10, he would instead have gotten around 13 500 dollars, given that the threshold would be 10 500 per month.
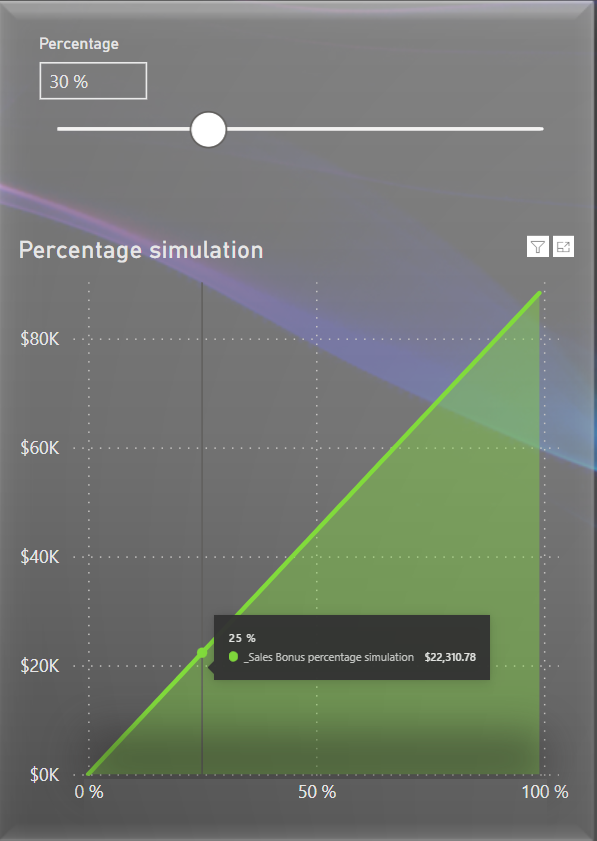
The same setup applies the other way around! If the threshold was set to 5 000 dollars, Andrew would have gotten a total of 22 310 dollars given that that ge got 25% of the exceeding amount.
Now this is a Power BI report and therefor it’s interactive by default, right. Cool things start to happen when you start playing with the filters! For some reason we only want to look at the outcome of 1997, but we don’t want to include February and we want to include every seller except for Anne Dodsworth, again for reasons unknown. We quickly see that the bonus amount for a threshold of 5 000 dollars and 30% return of exceeding value would yield a total bonus of about 73 600 dollars but the simulation graphs are also changed to respect our filters!
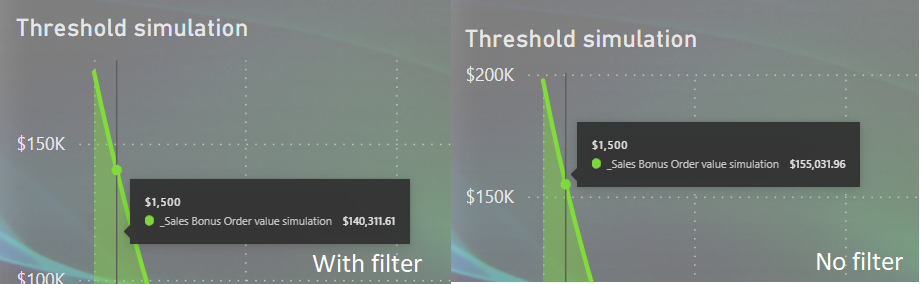
If I for example compare the threshold simulator at 1 500 dollars with the filter of not showing February as well as not showing Anne (left image) with including February and Anne (right image) I can see the exact bonus amount that would be different. Now imagine calculating this by hand..
If you note that there’s a slight shade in the simulator area charts and want to give credit where credit is due, reach out to Mustafa who posted this LinkedIn activity where I first learned of this trick (and of course had to try it out myself). You can also download his sample from github here!
How it’s done in Power BI under the hood
I’m using the Northwind dataset for this exercise and I’m pretending that the employee table is a table of all sales people in the organization and that an order from the Order table was simply sold by the connected sales person.
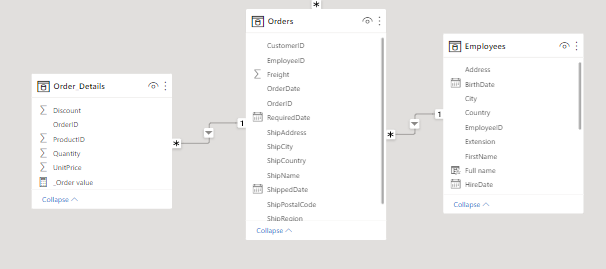
I have created a Calendar table, which is described in another blog post here!
The Date is currently related to “OrderDate” in the Order table.
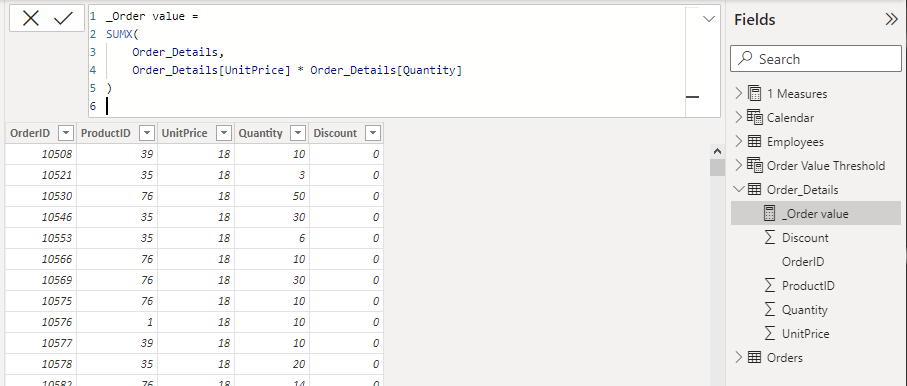
First we need to calculate the total order value. In Order Details I only have the unit price and the quantity for each order. To get the total sum I need to multiply them together. This is done with a SUMX measure but could just as well have been done by a calculated column, since we need to make the calculation row by row.
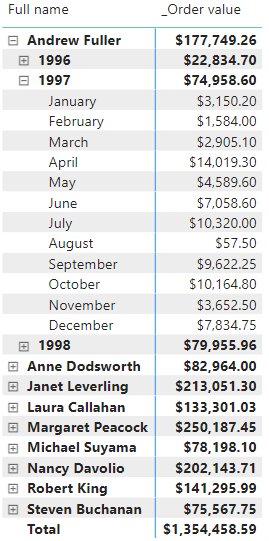
Using this measure I can now see the total amount of sales (or order value) by person, year and month in a matrix:
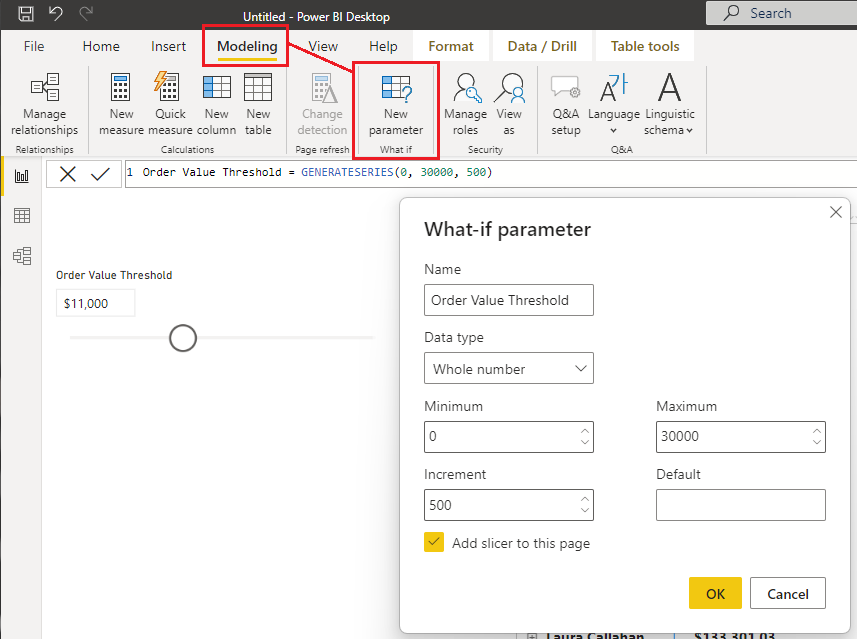
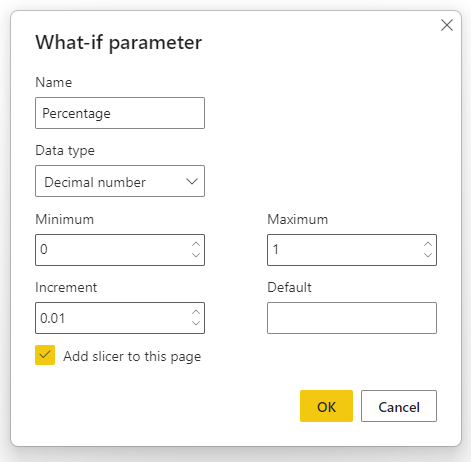
Next we’ll create a What-If parameter for our order threshold.
I’m also creating one for the percentage like this:
With everything in place, let’s get started with some DAX! I’m going to build this block by block so hopefully it will be easier to understand why it behaves like it does.
The first step is to determine if the Order Value is greater than the threshold. If so, we only want the value that exceeds the threshold value. The Blank() for if false is actually not needed but I added it for extra clarity (and to make the DAX statement longer. You know, to impress people).
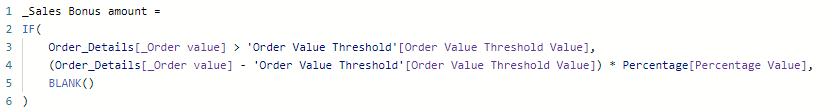
_Sales Bonus amount =
IF(
    Order_Details[_Order value] > 'Order Value Threshold'[Order Value Threshold Value],
    (Order_Details[_Order value] - 'Order Value Threshold'[Order Value Threshold Value]) * Percentage[Percentage Value],
    BLANK()
)
This will not work though. You see, a measure is always calculated in its context. Super important!
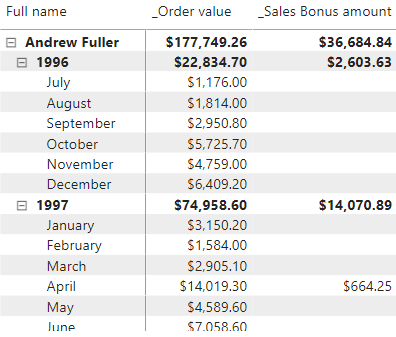
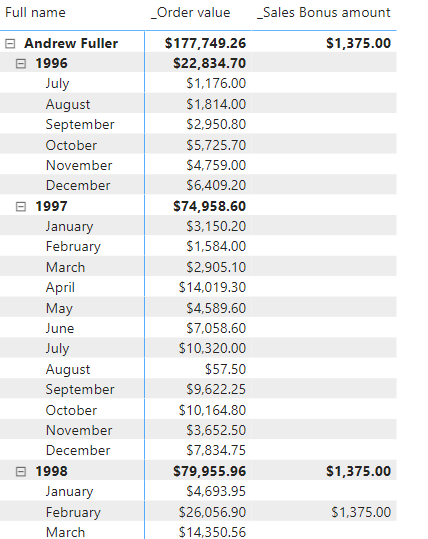
My threshold value was set to 11 000. In the context of “Full name” only, meaning the total sum for a sales person like Andrew Fuller, the order value of 177 000+ exceeds 11 000 by far! My percentage was set to 22% meaning it will take everything above 11 000 and take 22% of that as the bonus value. In 1996 the bonus would have been over 2 600 dollars, even though he failed every single month.
To solve this, we need to calculate the IF-statement for each possible row of our matrix. Our matrix consist of both employees as well as dates though. Introducing nested SUMX! By running a SUMX inside of another SUMX, we will achieve the goal of calculating the expression for each person, each month.
Our new measure looks like this:
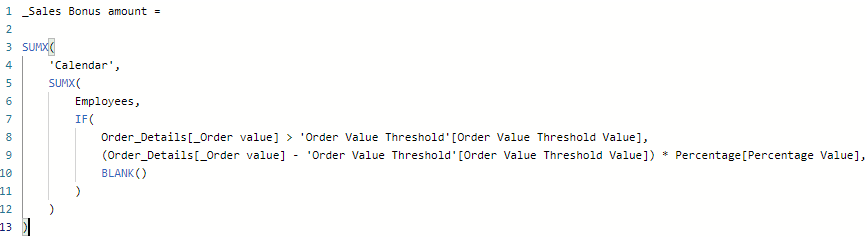
_Sales Bonus amount =

SUMX(
    'Calendar',
    SUMX(
        Employees,
        IF(
            Order_Details[_Order value] > 'Order Value Threshold'[Order Value Threshold Value],
            (Order_Details[_Order value] - 'Order Value Threshold'[Order Value Threshold Value]) * Percentage[Percentage Value],
            BLANK()
        )
    )
)
This will also fail though. Why? Well because our calendar has 1 row for each day, not for each month.
Andrew was successfully selling over the threshold 1 day in February 1998 and and thus he gets 22% of the exceeding value for that specific day.
The solution is to temporary create a smaller calendar table within our DAX statement. We do this by adding a SELECTCOLUMN from the Calendar table where we only retrieve the year and month. Oh, and we also add a Distinct before all of this, because otherwise you would just end up with the very same problem as before. For each day of a month, you’d have a row with the year and month name over and over.
The new DAX statement looks like this:
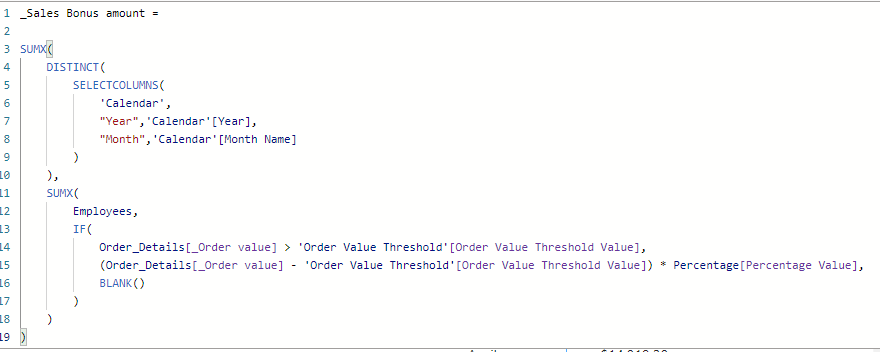
_Sales Bonus amount =

SUMX(
    DISTINCT(
        SELECTCOLUMNS(
            'Calendar',
            "Year",'Calendar'[Year],
            "Month",'Calendar'[Month Name]
        )
    ),
    SUMX(
        Employees,
        IF(
            Order_Details[_Order value] > 'Order Value Threshold'[Order Value Threshold Value],
            (Order_Details[_Order value] - 'Order Value Threshold'[Order Value Threshold Value]) * Percentage[Percentage Value],
            BLANK()
        )
    )
)
And now it finally works as it’s supposed to! Each month is calculated individually and added together on a yearly basis and finally added together for Andrew as a total!
This same solution would also work great with any other X function such as COUNTX or AVERAGEX if one would want to see the amount of successful months a person has had or the average amount of monthly bonuses a person has received.
Could we try even more nesting? Of course! Let’s add a third nested SUMX to a new measure like this. Here I’ve added the SUMX after Employees and switched out the selected Percentage value to the Percentage column, meaning that we will make the same calculation as we did before except this time we will try out each percentage in our what if table!
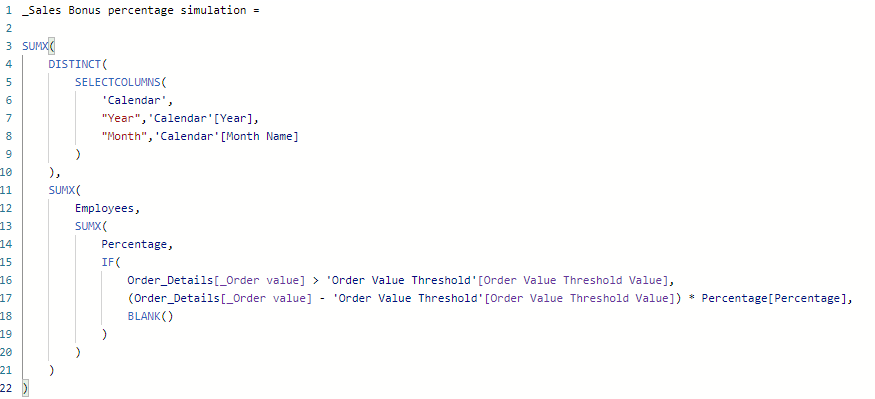
_Sales Bonus percentage simulation =
SUMX(
DISTINCT(
SELECTCOLUMNS(
'Calendar',
"Year",'Calendar'[Year],
"Month",'Calendar'[Month Name]
)
),
SUMX(
Employees,
SUMX(
Percentage,
IF(
Order_Details[_Order value] > 'Order Value Threshold'[Order Value Threshold Value],
(Order_Details[_Order value] - 'Order Value Threshold'[Order Value Threshold Value]) * Percentage[Percentage],
BLANK()
)
)
)
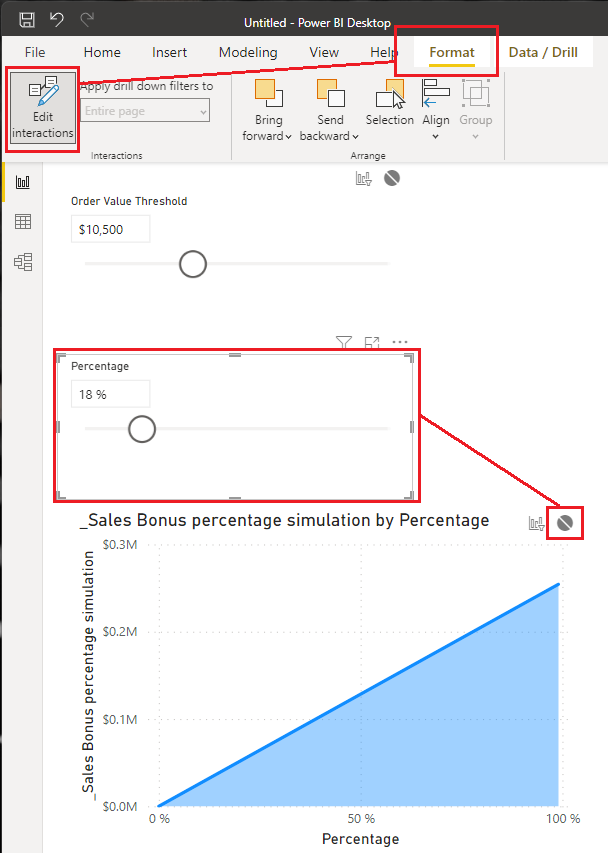
)It’s important that you disable the interaction between the diagram and the filter though, otherwise the filter will remove all other values than the one selected and your simulation wont actually show anything.
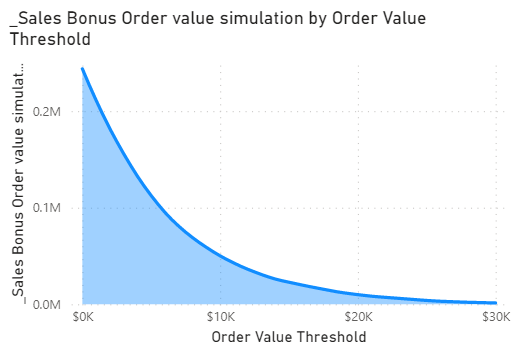
And we can do the same simulation for the threshold value as well! In this case we’ll go through each row of the threshold table like this:
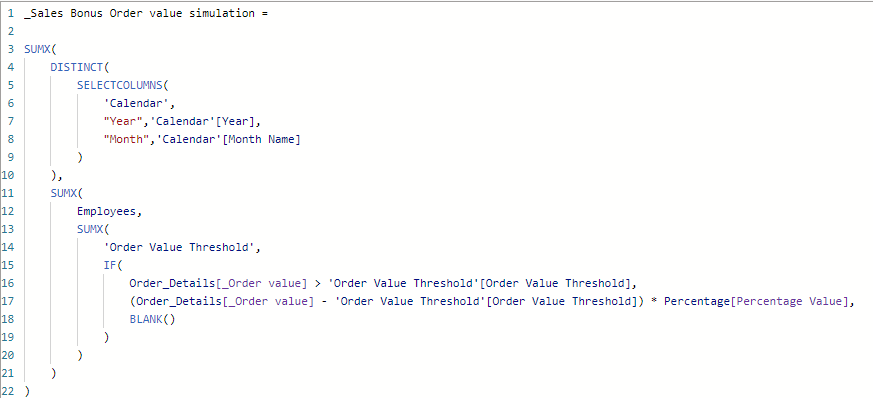
This graph is a bit more exciting as it’s not just linear.
The last part for the result is just adding some color and layouts to make it look good!
Hope this helped! If you have any questions feel free to reach out!
Cheers!