Generating an Observation-Table with DAX
We all strive for what really matters in life, enriching data, so I understand that I already preach to the choir with this blog post 😉 If you are however in that outlier percent of people with other, weird, interests in life, let me introduce you to what I mean by “Observation Table” and why you should want it!
Assume a scenario where you have a lot of structured data in your Power BI model and it’s regarding Construction site incidents. The report looks really neat and gives a ton of abilities to slice and dice your data for great insights. We might for example filter the sites to only show those what have had more than 10 accidents from falling objects, never reported another type of incident, the site size is below a certain threshold and the number of workers on this site is above a certain threshold. We could for example assume that the sites matching these criteria should have flyers put up to inform of the dangers of falling objects, to prevent more accidents. While this is all great, it requires someone looking at the report to come up with these settings and apply them. What if, instead, we added such logic to an observation table to generate these insights automatically and simply flag the sites?
For the rest of this post, I’ll use Microsoft 365 Usage data to exemplify!
Here I have a table with aggregated usage in M365. Each line represent the usage from one user over a period of roughly 1 month. There’s a lot more columns in this table, but you get the idea, right?
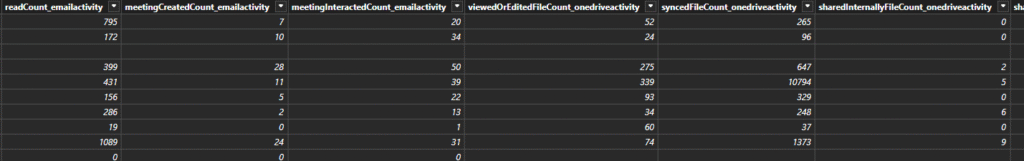
Here’s a few examples of columns that I have in my table:
- usedWeb_teamsdeviceusage
- usediOS_teamsdeviceusage
- usedMac_teamsdeviceusage
- usedAndroidPhone_teamsdeviceusage
- usedWindows_teamsdeviceusage
These represent the number of days that the user have access Microsoft Teams using a certain device. If it says 4 on usedWeb, it simply means that during 4 separate dates, the user logged into Teams from the web client at least once during those days.
Perhaps you’re starting to see where this is going. By combining these we can derive if a user has been logging into Teams from a Web, Windows or Mac Device, but not from iOS or Android. This would mean that the user is in fact using Microsoft Teams, just never from a mobile device.
So let’s set up the Observation Logic table first! What I’ve done is simply copied the schema of the facts table so that I have the same set of columns but with a suffix. In my case I gave them the suffix of _obs, short for observation.
Next, I simply started typing some sample observations in an Excel file, like this:
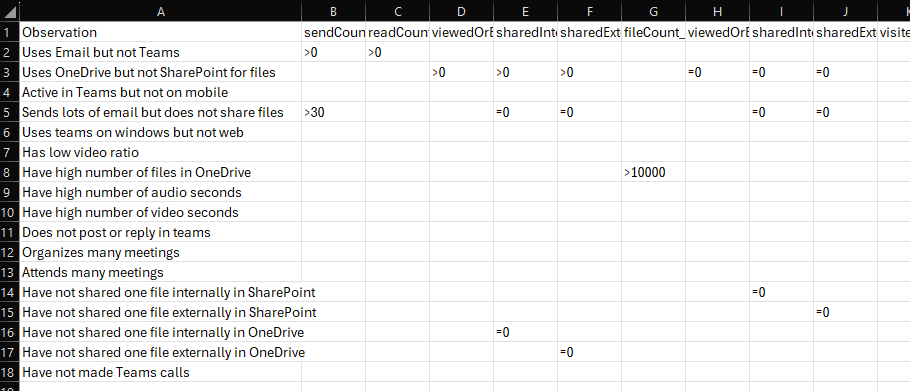
This table is then manually imported into my Power BI model as a table named “Observation Logic”.
Note that all my metrics have an initial character in the form of =, > or <. I also built in ! as an option which you will see further down.
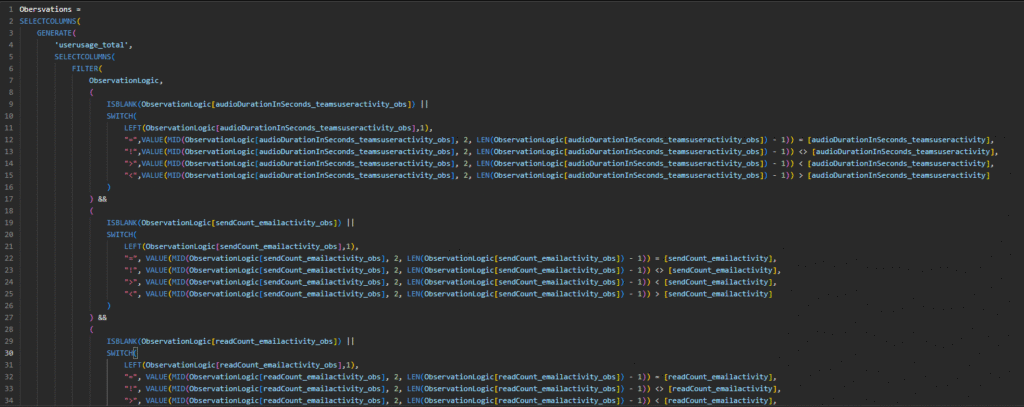
OK, so to generate the actual observation table, I’m using the Generate formula. This formula “Returns a table with the Cartesian product between each row in table1 and the table that results from evaluating table2 in the context of the current row from table1.”
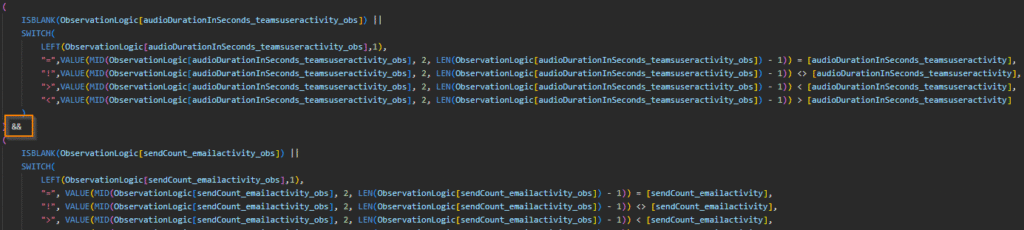
In my case, I simply start with my aggregated usage table as Table 1. I then add rows from the Observation-logic table if the criteria of the observation is met! This is a snippet of the logic. While the formula is a bit long, it simply repeats the same logic over each column of the table, so the more columns you have the longer the formula, but it’s really the same check each time so it’s really simple to extend!
Allright let’s break it down some more. Note the first part here says “IsBlank” and then references the column. This is going to be true, if the column is indeed null. This is important because it will always be true for columns that are not included in the criteria for an observation, i.e. the value is null and the check should be skipped. The two pipes (||) at the end specifies that this is the first of an OR statement. The second input is a Switch that grabs that first, important, character of the cell. You might remember that this could be =, >, < or ! and depending on what character it is, different logic applies. You can see that in the end of the calculation here on each switch result.
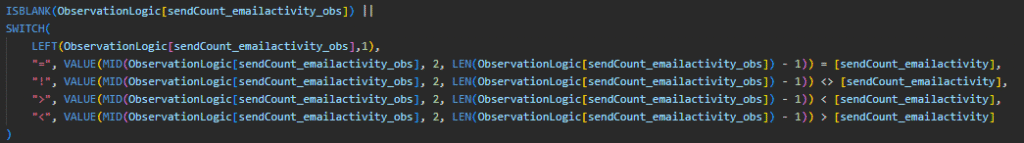
The && here is an AND statement and it simply goes over to the next column to check that in the same way. This pattern repeats for each column of the table.
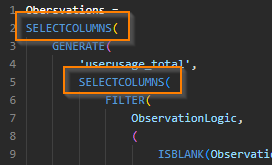
In the very beginning of this formula, there’s 2 “Selectcolumns”. Since the formula is so large, the second portion of this formula doesn’t come until the very end though 🙂
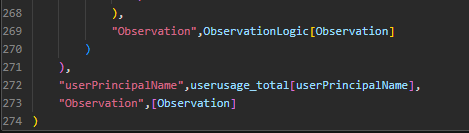
All the way down on row 269 we have the inner (second) Selectcolumns second argument. This means that the only thing we import into the full table is the Observation column.
The first Selectcolumns on Row 2 ends here on row 272 and 273, specifying that the only 2 columns we take from this entire calcuation is the username and observation.
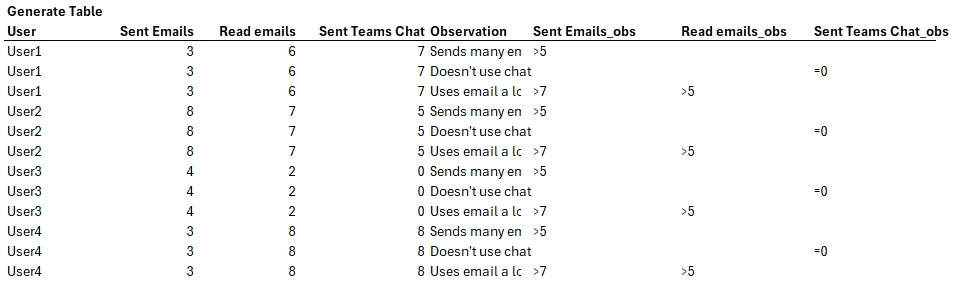
Here’s an explanation of what’s going on in a little bit simpler terms. Imagine you have these 2 tables:
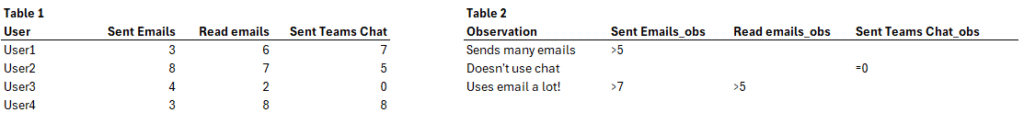
What we’re doing is starting from Table1 in our Generate-formula and then we add rows from the second table if they match the criteria. Without any filtering on the second table, it would simply look like this, with all rows added from both tables and all columns from both included.
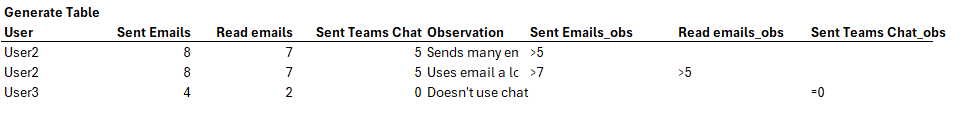
When we do apply the filtering on the second table, the result is instead this:
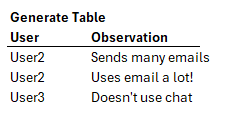
And from this table, we simply make the Selectcolumns so that we only inlcude User and Observation, like this:
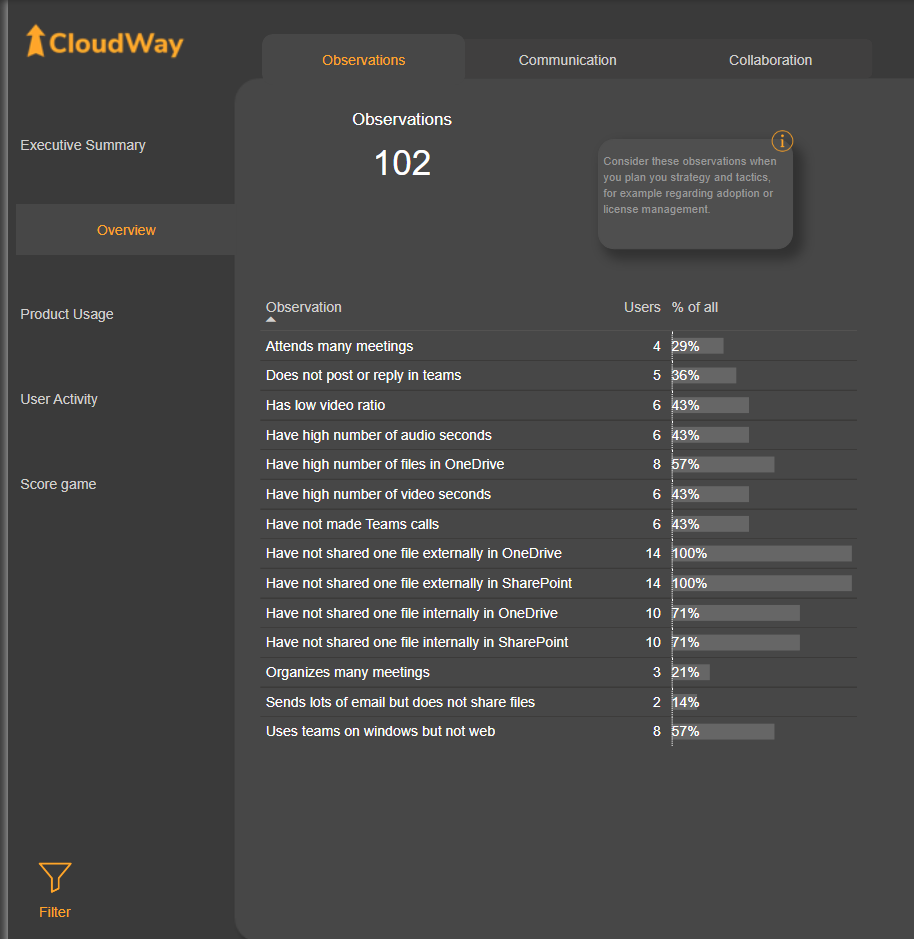
And now it’s just a matter of visualizing your new found observations in a report! I have for example made a simply table like this to reflect the number of users we’ve made a certain observation for since we can then select an observation to dive into the details of who to target our adoption campaigns against!
As some final notes I want to say that this whole solution should only be utilized if you’re unable to move the logic upstream in your data transformation!
This type of DAX table is great for generating fast output when testing your ideas of different observations, but when you have the logic table, consider moving it away from DAX. I do however appreciate that this is not always possible, sometimes you might build the whole report based on CSV or Excel files and that still provides business value! Such a report could also benefit from an observation table like this 😉
Cheers!