Trackmania Analyzer – Part 3 – Calculations
In this third and final blog post of the Trackmania series I’m focusing on the Calculations, both for columns as well as measures.
Trackmania Analyzer – Part 1 – Using the report
Trackmania Analyzer – Part 2 – Data Transformation
This blog post covers the calculated table, followed by the calculated columns and finally the measures. As before,
Calculated Table
I only have one calculated table in the report and it’s the “Dim Location”. It’s used as a master to determine the racing line of the track.
I’m basing this out of whoever has the best run of the entire track for simplicity. I considered trying to find more information about the actual map in the GBX file or look at each checkpoint section individually to find the fastest path through the map, but at the end of the day it was enough to just use one of the runs as the master.
Dim Location =
// This table is the dimension of location
// it is based on the fastest run
VAR BestRun =
SELECTCOLUMNS(
TOPN(
1,
'Dim Runs',
'Dim Runs'[TotalMilliseconds],
ASC
),
"Name",
'Dim Runs'[Name]
)
Return
SELECTCOLUMNS(
FILTER(
'Fct Racer RecordData',
'Fct Racer RecordData'[Name] = BestRun
),
"Position.X",
'Fct Racer RecordData'[Position.X],
"Position.Y",
'Fct Racer RecordData'[Position.Y],
"Position.Z",
'Fct Racer RecordData'[Position.Z],
"Name",
'Fct Racer RecordData'[Name],
"Section",
'Fct Racer RecordData'[Checkpoint Section],
"Index",
'Fct Racer RecordData'[Index by run]
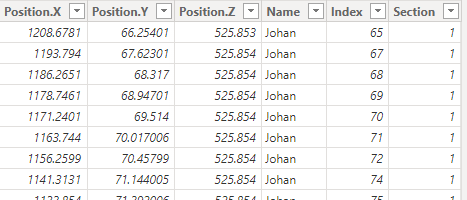
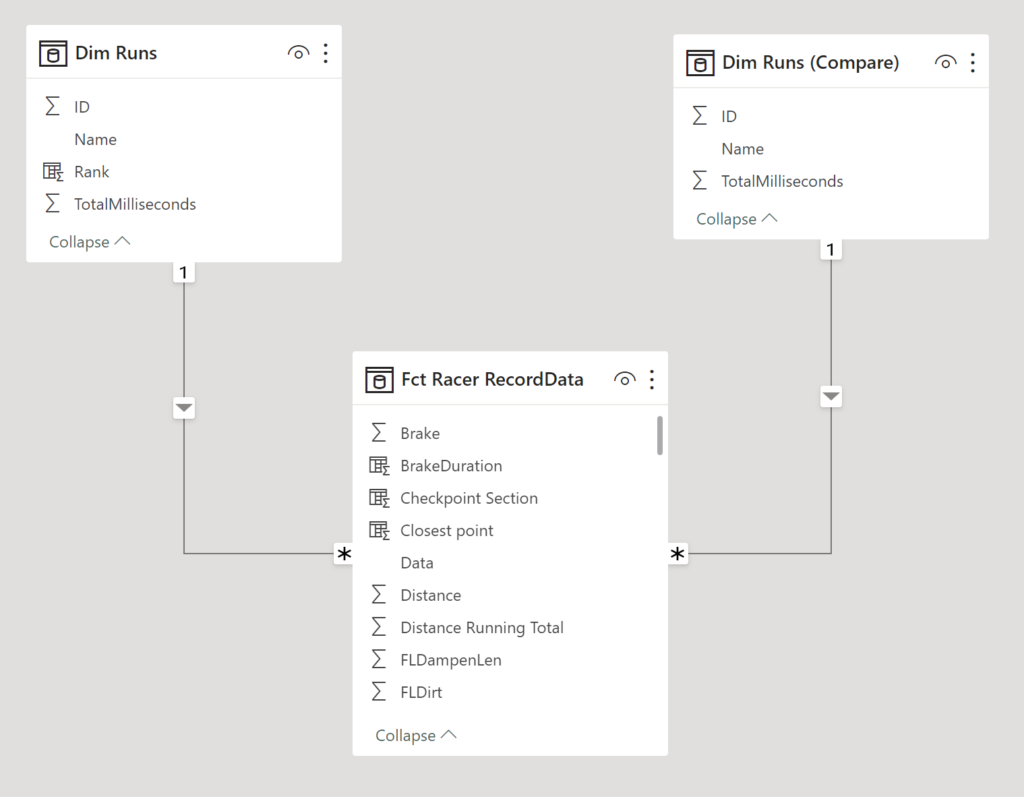
)The result is a Table that looks like this:
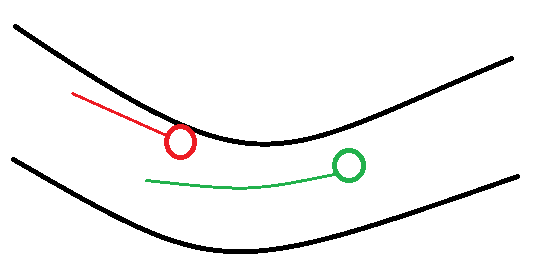
This is used to squeeze all the graphs to the same X axis that is determined by where you are on the map instead of time. Behold my mighty Paint-skills! Imagine 29 seconds have passed and the red dot is going into the corner while the green dot is leaving it (note the trailing). Using time as a dimension makes no sense here, see? Comparing a graph of avg speed here would most likely show the green dot as slower than the red one and to advice the red dot to speed up would result in a crash. Not very useful.
Using the table above, I’m instead able to plot stuff over the index of the green dot later on.
Calculated columns
Fct Racer PlayerInputs
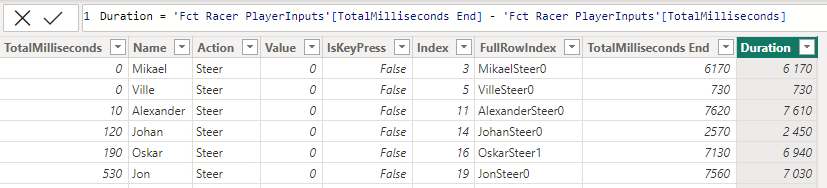
I have 2 calculated columns in this table. One is super simple, it’s just the duration of the action and it’s calculated by subtracting the total MS from when the action ended from when it started.
The other one is however a bit more complicated. Could this be made simpler? I’m 100% sure of it! Please reach out with your ideas of improvement <3
This is the formula to calculate the TotalMilliseconds End.
TotalMilliseconds End =
VAR Lenght = LEN('Fct Racer PlayerInputs'[FullRowIndex])
Return

LOOKUPVALUE(
    'Fct Racer PlayerInputs'[TotalMilliseconds],
    'Fct Racer PlayerInputs'[FullRowIndex],
    IF( // Check to see if the last 3 digits are in fact digits (supporting up to 999 inputs. If this is an error, this is a lesser index
        ISERROR(
            VALUE(
                RIGHT(
                    'Fct Racer PlayerInputs'[FullRowIndex],
                    3
                )
            )
        ),
        IF( // This runs if the last 3 digits are not digits. That means it 2 or less
            ISERROR(
                VALUE(
                    RIGHT(
                        'Fct Racer PlayerInputs'[FullRowIndex],
                        2
                    )
                )
            ),
            LEFT( // This is the lookup value if the index is 1-9
                'Fct Racer PlayerInputs'[FullRowIndex],
                Lenght-1
            )
            &
            FORMAT(
                RIGHT(
                    'Fct Racer PlayerInputs'[FullRowIndex],
                    1
                ),
            00) +1,
            LEFT( // This is the lookup value if the Index is 10-99
                'Fct Racer PlayerInputs'[FullRowIndex],
                Lenght-2
            )
            &
            FORMAT(
                RIGHT(
                    'Fct Racer PlayerInputs'[FullRowIndex],
                    2
                ),
            00) +1
        ),
        LEFT( // This is the lookup value if the index is 100-999
        'Fct Racer PlayerInputs'[FullRowIndex],
        Lenght-3
        )
        &
        FORMAT(
            RIGHT(
                'Fct Racer PlayerInputs'[FullRowIndex],
                3
            ),
        00) +1
    ),
    'Fct Racer PlayerInputs'[TotalMilliseconds]
)
I’m looking up the beginning value of the next step essentially.
If I filter on only steering for 1 user you can see the pattern here. Since I have 1 row for each key press and 1 for each release, it adds up.
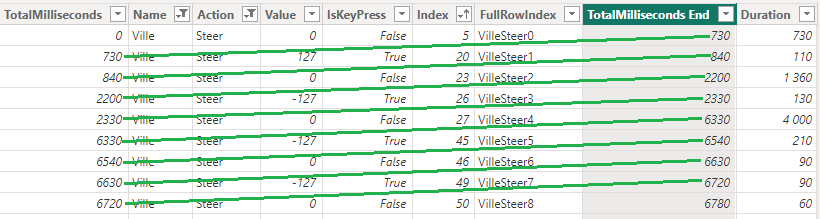
So why do I want this? Well let’s step it up another notch and have a look at the next table.
Fct Racer RecordData
Duration-columns
To show you why I did the previous calculation, you first need some background info.
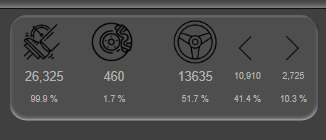
On the Deep Dive-pages there’s these visuals on how much time you’ve spent throttling, braking and steering. This shows amount of MS spent doing each operation and how much % of the total time you’ve spent doing that action.
The thing is that the Player Inputs are stored every 10 MS and the Sample Record data is stored every 50 MS. Most of the report uses the Sample Record Data that also happens to have a column built in for Brake and Gas (but not steer), but again that only shows per 50 MS! What if you released the input key right before the end of a sample? Would it not count? Perhaps I have a slight dose of Asperger’s but this could simply not stand.
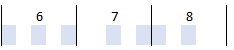
Imagine the inputs as Operation here. An Operation could be steering for example. Each time you push steer, it’s blue. Release and it’s white. 5 record samples of 50 MS each but 25 possible input samples at 10 MS each. For every record sample, there’s potentially 5 input samples. You get the point.
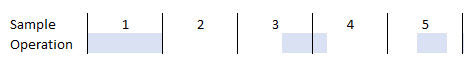
There are 5 record samples above and 5 different ways the operations could have been done:
- The operation was performed for the full sample
- The operation was not performed at all during the sample
- The operation started without the operation, the operation started within the sample and the sample ended with the operation still active
- The operation started before the sample but ended within it
- The sample started and ended within the sample
You actually have these possibilities as well, but they’re covered in the rule set of the 5 above
So what I did in the RecordDate table was calculated columns for each input that shows how many 10th of MS the action was applied for. In this sample image, during one sample the player steered to the right and used the throttle (gas) first for the whole sample of 50 MS and then stopped steering 20 MS into the next sample.
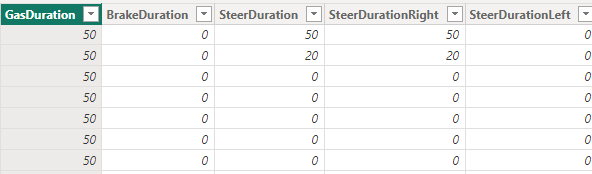
This columns are calculated like this (but you change out the operation and add a filter to right and left for steering).
GasDuration =
// Check incoming value
// Check value starting AND ending inside this record sample
// Check outgoing value

VAR IsKeyPressedDuringStartOfSample =
    LOOKUPVALUE(
        'Fct Racer PlayerInputs'[IsKeyPress],
        'Fct Racer PlayerInputs'[Index],
        CALCULATE(
            MAX('Fct Racer PlayerInputs'[Index]),
            FILTER(
                'Fct Racer PlayerInputs',
                'Fct Racer PlayerInputs'[TotalMilliseconds] <= 'Fct Racer RecordData'[TotalMilliseconds] &&
                'Fct Racer PlayerInputs'[Name] = 'Fct Racer RecordData'[Name] &&
                'Fct Racer PlayerInputs'[Action] = "Gas"
            )
        )
    )

VAR InputsInThisSample =
    CALCULATE(
        COUNTROWS('Fct Racer PlayerInputs'),
        FILTER(
            'Fct Racer PlayerInputs',
            'Fct Racer PlayerInputs'[TotalMilliseconds] >= 'Fct Racer RecordData'[TotalMilliseconds] &&
            'Fct Racer PlayerInputs'[TotalMilliseconds] < ('Fct Racer RecordData'[TotalMilliseconds] + 50) &&
            'Fct Racer PlayerInputs'[Name] = 'Fct Racer RecordData'[Name] &&
            'Fct Racer PlayerInputs'[Action] = "Gas"
        )
    )

Return


// INCOMING VALUE
// Check if there are any key presses or releases within this sample.
// If not (true) then whatever was active at the start of this sample will remain for the full time of it
IF(
    InputsInThisSample = 0,

    IF( // If true check if the key was pressed when coming into this sample and add 50 if so, otherwise 0
        IsKeyPressedDuringStartOfSample = TRUE(),
        50,
        0
    ), // If there are no inputs during this record, the calculation ends here with either all or nothing for the entire sample.

    IF(
        IsKeyPressedDuringStartOfSample = TRUE(),
        CALCULATE(
            MIN('Fct Racer PlayerInputs'[TotalMilliseconds]),
            FILTER(
                'Fct Racer PlayerInputs',
                'Fct Racer PlayerInputs'[TotalMilliseconds] >= 'Fct Racer RecordData'[TotalMilliseconds] &&
                'Fct Racer PlayerInputs'[TotalMilliseconds] < 'Fct Racer RecordData'[TotalMilliseconds] + 50 &&
                'Fct Racer PlayerInputs'[Name] = 'Fct Racer RecordData'[Name] &&
                'Fct Racer PlayerInputs'[Action] = "Gas"
            )
        ) - 'Fct Racer RecordData'[TotalMilliseconds],
        0
    )
)

+
// END OF INCOMING VALUE

// VALUE FROM INPUTS STARTING AND ENDING IN SAMPLE

CALCULATE(
    SUM('Fct Racer PlayerInputs'[Duration]),
    FILTER(
        'Fct Racer PlayerInputs',
        'Fct Racer PlayerInputs'[TotalMilliseconds] >= 'Fct Racer RecordData'[TotalMilliseconds] &&
        'Fct Racer PlayerInputs'[TotalMilliseconds End] < 'Fct Racer RecordData'[TotalMilliseconds] + 50 &&
        'Fct Racer PlayerInputs'[Name] = 'Fct Racer RecordData'[Name] &&
        'Fct Racer PlayerInputs'[Action] = "Gas" &&
        'Fct Racer PlayerInputs'[IsKeyPress] = TRUE()
    )
)
+
// END OF VALUE FROM INPUTS STARTING AND ENDING IN SAMPLE


// OUTGOING VALUE
// If there are no inputs in this sample, skip this step
// If there are inputs during this sample, fetch the last input timestamp
// If the last input of this sample is a keypress, add that value to the calculation. If the last step is a Key release, skip it
IF(
    InputsInThisSample = 0 ||
            LOOKUPVALUE(
            'Fct Racer PlayerInputs'[IsKeyPress],
            'Fct Racer PlayerInputs'[Index],
            CALCULATE(
                MAX('Fct Racer PlayerInputs'[Index]),
                FILTER(
                    'Fct Racer PlayerInputs',
                    'Fct Racer PlayerInputs'[TotalMilliseconds] >= 'Fct Racer RecordData'[TotalMilliseconds] &&
                    'Fct Racer PlayerInputs'[TotalMilliseconds] < 'Fct Racer RecordData'[TotalMilliseconds] + 50 &&
                    'Fct Racer PlayerInputs'[Name] = 'Fct Racer RecordData'[Name] &&
                    'Fct Racer PlayerInputs'[Action] = "Gas"
                )
            )
        ) = FALSE(),
    0,

    ('Fct Racer RecordData'[TotalMilliseconds] + 50) -
    CALCULATE(
        MAX('Fct Racer PlayerInputs'[TotalMilliseconds]),
        FILTER(
            'Fct Racer PlayerInputs',
            'Fct Racer PlayerInputs'[TotalMilliseconds] >= 'Fct Racer RecordData'[TotalMilliseconds] &&
            'Fct Racer PlayerInputs'[TotalMilliseconds] < 'Fct Racer RecordData'[TotalMilliseconds] + 50 &&
            'Fct Racer PlayerInputs'[Name] = 'Fct Racer RecordData'[Name] &&
            'Fct Racer PlayerInputs'[Action] = "Gas"
        )
    )
)

// END OF OUTGOING VALUE
Checkpoint Section
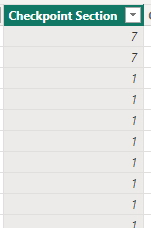
To simplify filtering, I added the CheckPoint Section to each row of the sample data. This is then used to filter parts of the map that you want to deep dive into from the Filtering window.
Checkpoint Section =

CALCULATE(
    MIN('Dim Racer Checkpoints'[Index]),
    FILTER(
        'Dim Racer Checkpoints',
        'Dim Racer Checkpoints'[TotalMilliseconds] >= 'Fct Racer RecordData'[TotalMilliseconds] &&
        'Dim Racer Checkpoints'[Name] = 'Fct Racer RecordData'[Name]
    )
)
Closest point
We have come at last to the reason behind the entire calculated table “Dim Location”!
I need to know where people were on the track, not for how long they have been driving. I’m using the DIM Location as a master table of the track and racing line. Each sample is then connected the the closes point of the Dim Location.
There’s 50 MS between each sampling, so a slower driver will produce more samples than a fast one. Imagine that for a fraction of a second, the red player produced 4 samples and the green player (who was also the best one and thus created the dim location table) have 3 samples. 2 of the red samples are now connected to the same green sample.
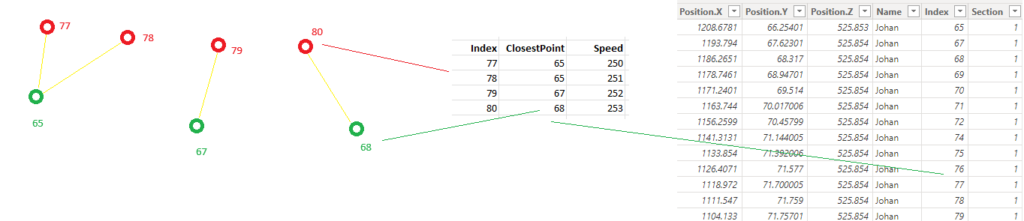
When I’m plotting information from the Record-table, such as speed, I’m always using the average. This way it doesn’t matter that multiple samples are connected like this, as they will simply be averaged.
In the example above, the result would look like this:
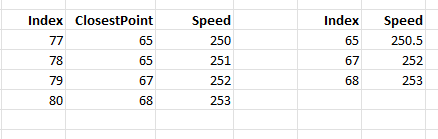
The red players sample 77 and 78 are both merged and averaged into index 65 of the track, if you will.
To calculate the closest point I’m looking at X, Y and Z, so it’s actually in 3D! You see the track might go up or down and cross itself, so just looking at the X and Y is not enough. But hey.. Someone might make a really high jump underneath the next part of the track and that point might get closer to another player if they are on opposite sides of the road! Imagine something like this. The green, best, time jumps in the left side of the road (that becomes the right side when driving the other direction later). The Red player drives close to the dot and it actually becomes the closes point.
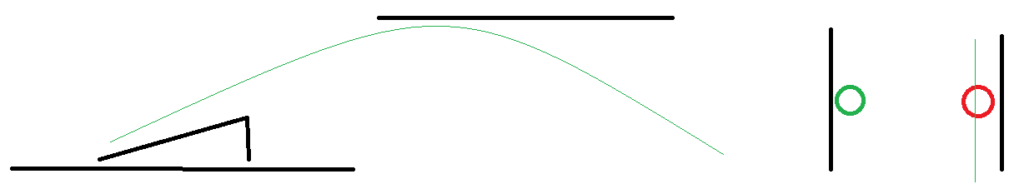
To make sure this doesn’t happen, I’m only looking for the closest sample point within the same Checkpoint section as the sample! Most tracks, I assume, have a good deal of checkpoints and that would not only speed up my calculations but also solve the potential (not very probable) issue.
The calculated columns has this formula!
Closest point =
// D = Square root of (x -x)2 + (y - y)2 + (z - z)2

VAR CalculatedTable =
SELECTCOLUMNS(
    FILTER(
        'Dim Location',
        'Dim Location'[Section] = 'Fct Racer RecordData'[Checkpoint Section]
    ),
    "Index",'Dim Location'[Index],
    "DistanceToPoint",
        SQRT(
            POWER(
                'Dim Location'[Position.X]-'Fct Racer RecordData'[Position.X],
                2
            )
            +
            POWER(
                'Dim Location'[Position.Y]-'Fct Racer RecordData'[Position.Y],
                2
            )
            +
            POWER(
                'Dim Location'[Position.Z]-'Fct Racer RecordData'[Position.Z],
                2
            )
        )
)

VAR MinDistance =
    MINX(
        CalculatedTable,
        [DistanceToPoint]
    )

VAR IndexValue =
    MINX(
        FILTER(
            CalculatedTable,
            [DistanceToPoint] = MinDistance
        ),
        [Index]
    )

Return

IndexValue
And that finishes up the calculated columns in the report!
Measures
This report has a ridiculous amount of measures in it! The reason is the way I wanted to create the Deep dive and the compare page with so many individual card visuals. Each of them is it’s own measure.
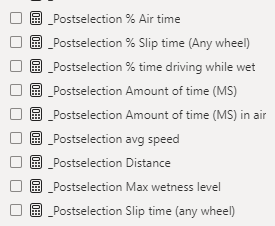
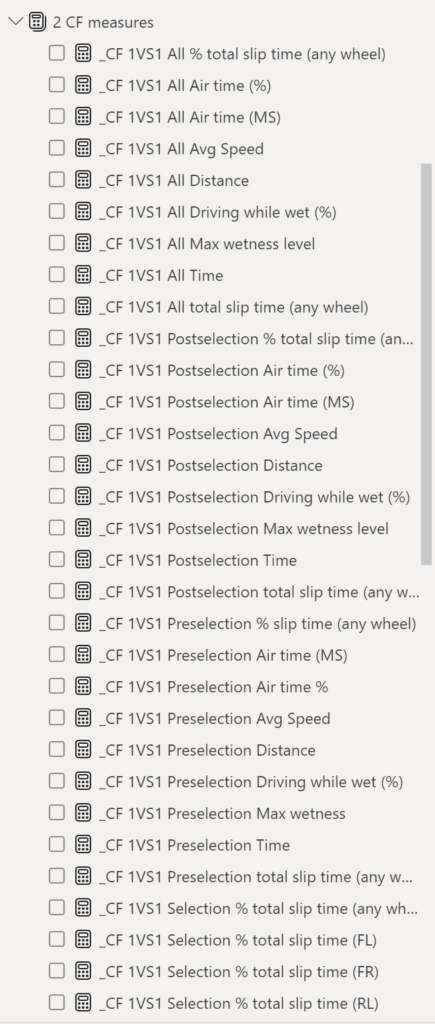
This is just a subset of them. I wont go through all of them as most of them are duplicates of each other with just small changes.
There are a few categories of measures here
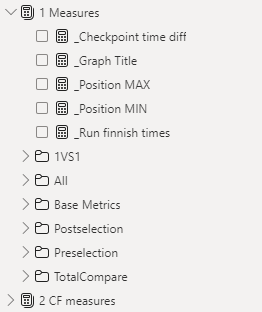
The first ones are just miscellaneous measures. The base metrics is stuff like this:
Really simple measures that just sums columns or create percentages from 2 measures. These base measures are then used within all the Post- and Preselection measures.
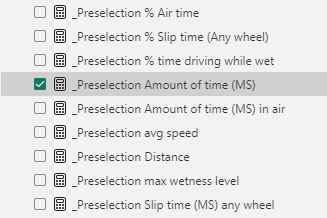
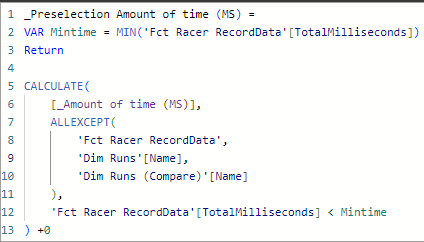
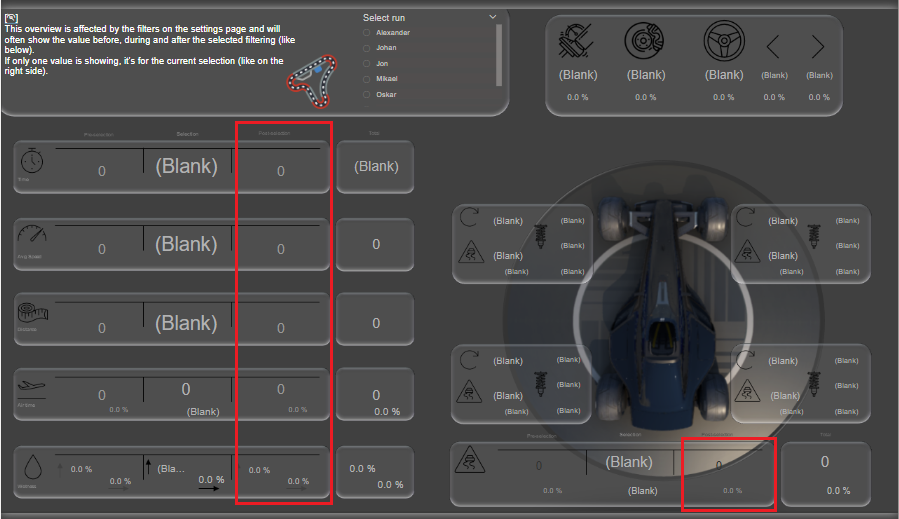
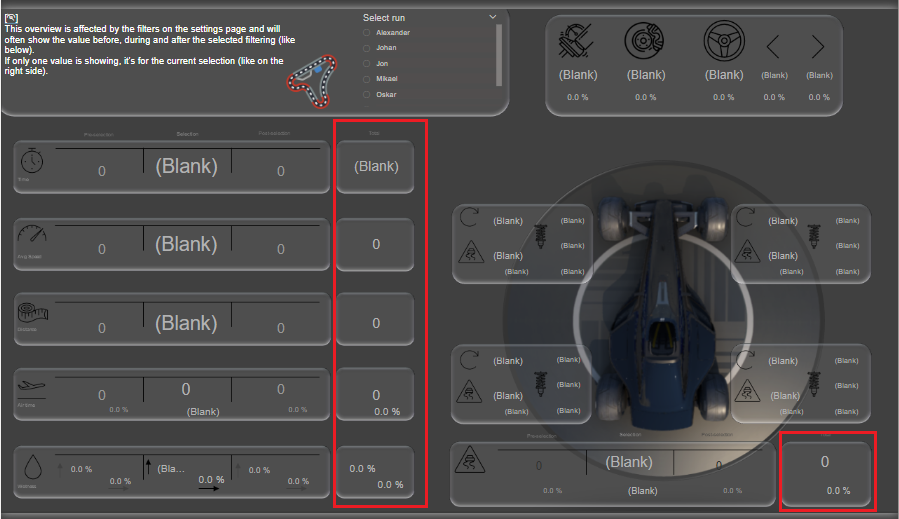
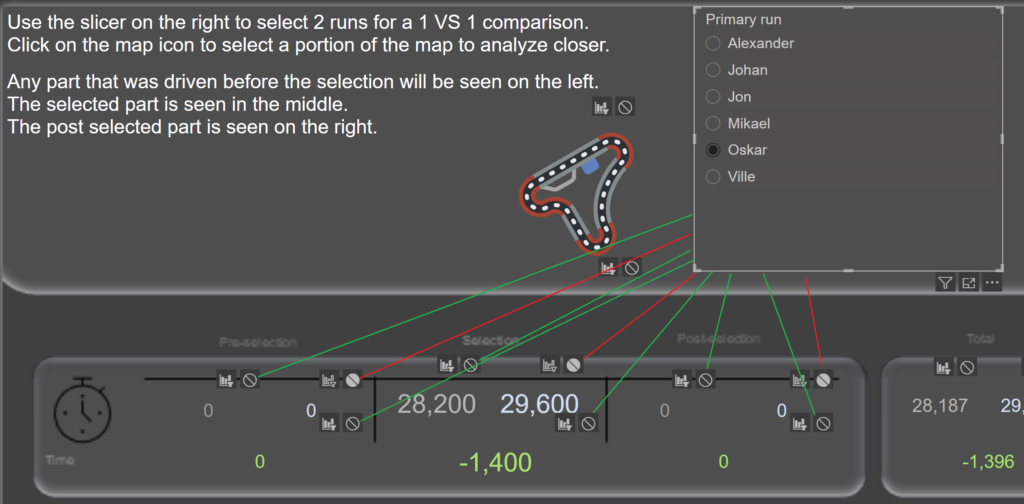
On the deep dive, there are values to be shown before the filtered selection of the track. These metrics can be seen here. They’re the ones I call Preselection measures.
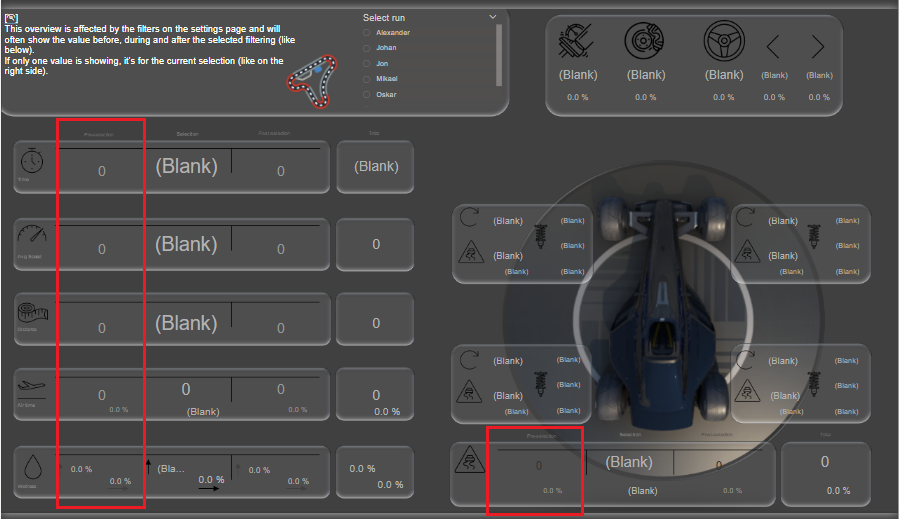
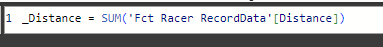
Each value is a measure that looks like this, but of course with different nested measures in the Calculate.
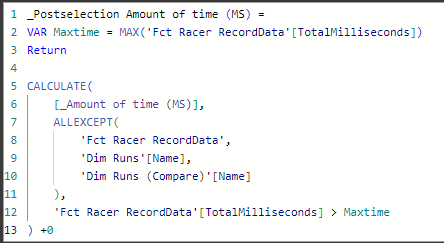
The same is then done for all the post selections.
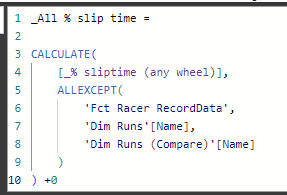
The All-category is for measures to never be filtered, like these:
The look like this and they’re only filtered by the run selected in either the deep dive or the 1 VS 1 page.
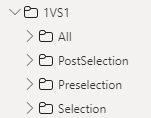
OK so next let’s look into the 1VS1-category. Within that, there’s actually a subset of measures again!
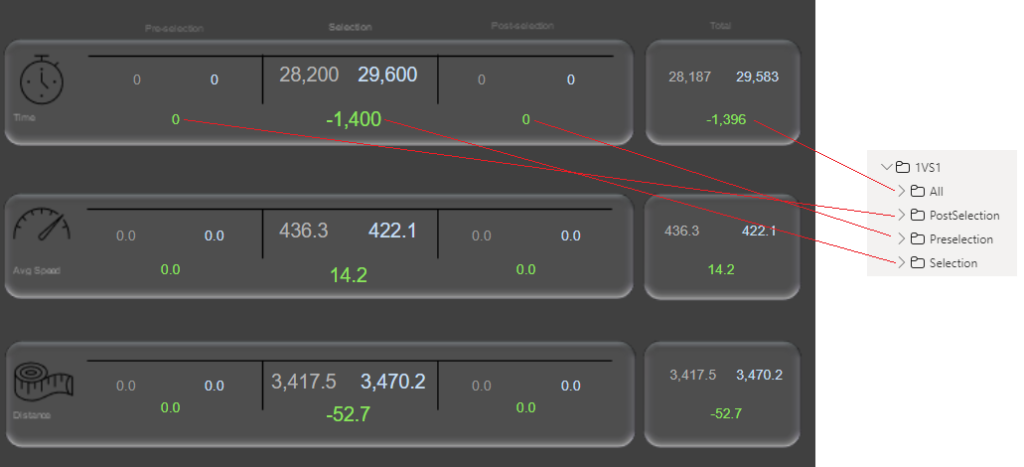
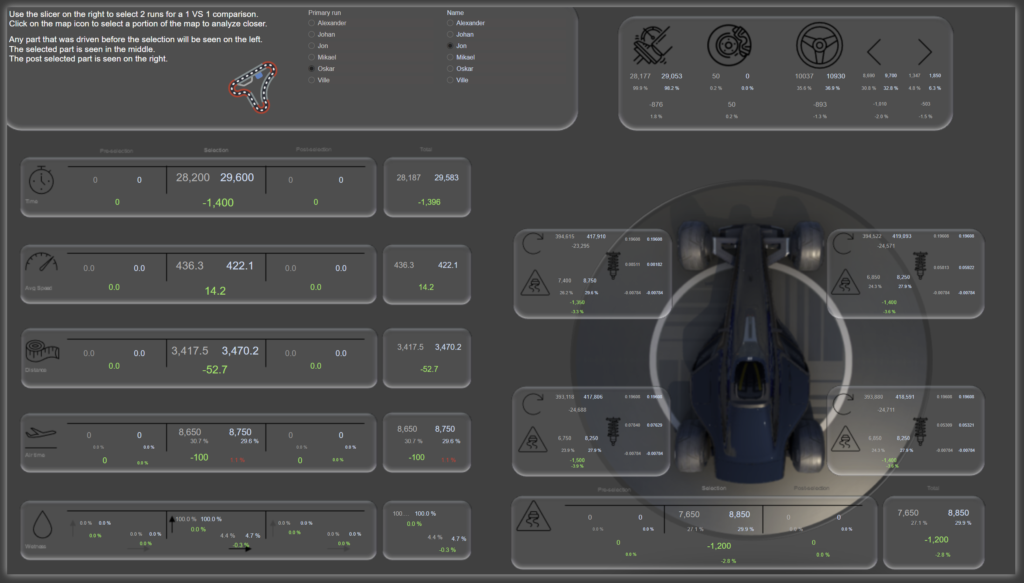
These are used on the 1VS1 Deep Dive page like this. Each diff value between the selected run and the compared run is a measure in here, so there are the same 4 categories but for the differences.
“So hey! How come you didn’t make them for the blue metrics there? The compare run value? Shouldn’t they also be their own measure?”
Nope! Before I reveal how the measures are calculated above, let’s make a quick detour to “Interactions”.
When you have selected any visual, you can activate “Edit interactions” in the format tab like this.
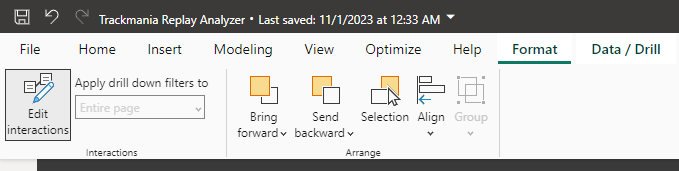
With interactions on, any time you select a visual that can be filtered (like a slicer, a graph etc) you can select how it should interact with other visuals. My Primary run-slicer interacts with the blue, first, values as well as the diff. My compare run-slicer interacts with the grey, second, values and the diff.
“Haha but wait, doesn’t that mean you would end up with an extreme amount of selecting interactions on this page?”
Yes. The answer is yes. This is one of the 2 slicers…
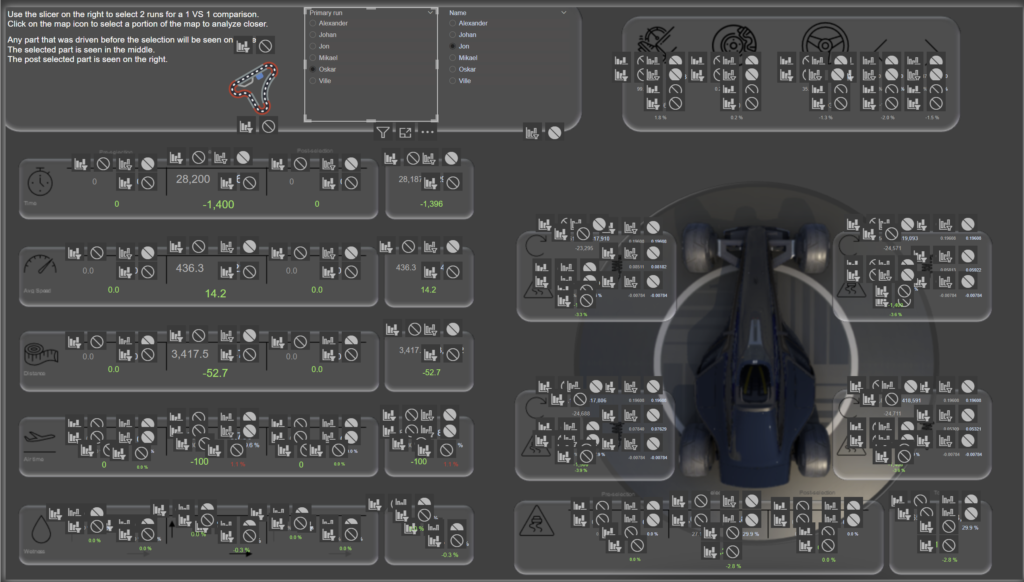
The model looks like this, so the interactions work just fine and I’m able to use the same measure for both the primary and compare run values. When selecting a run in the Compare-table it will filter only that run from the record data and the primary run table doesn’t filter the value at all.
Both of them interact with the diff value though! So how is that possible? If you filter the record data so it only shows Villes run but at the same time it should only show Jons run, there would be no records matching.
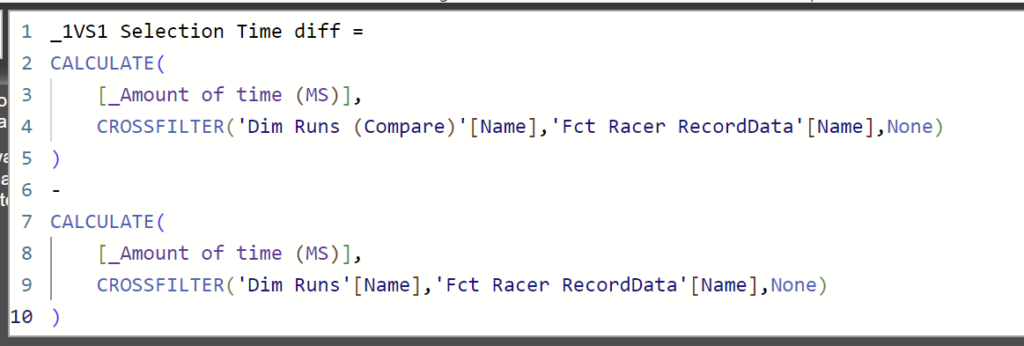
The answer is a new measure! All of the diff measures (preselection, selection and postselecation) make use of Crossfilter. This removes the relationship temporarily in the measure so for the time diff here it first takes the amount of time-measure with only the primary run relationship active and then subtracts that value from the same measure, but this time with only the compare tables relationship intact.
“So wait… There’s an individual measure for all of the green and red values on this screen?”
Well… Yes. But there’s even more actually. The red and green indicates good or bad and for some diff values I don’t make that distinction. Steering, throttling and damping for example. Those are also individual measures but they’re grey.
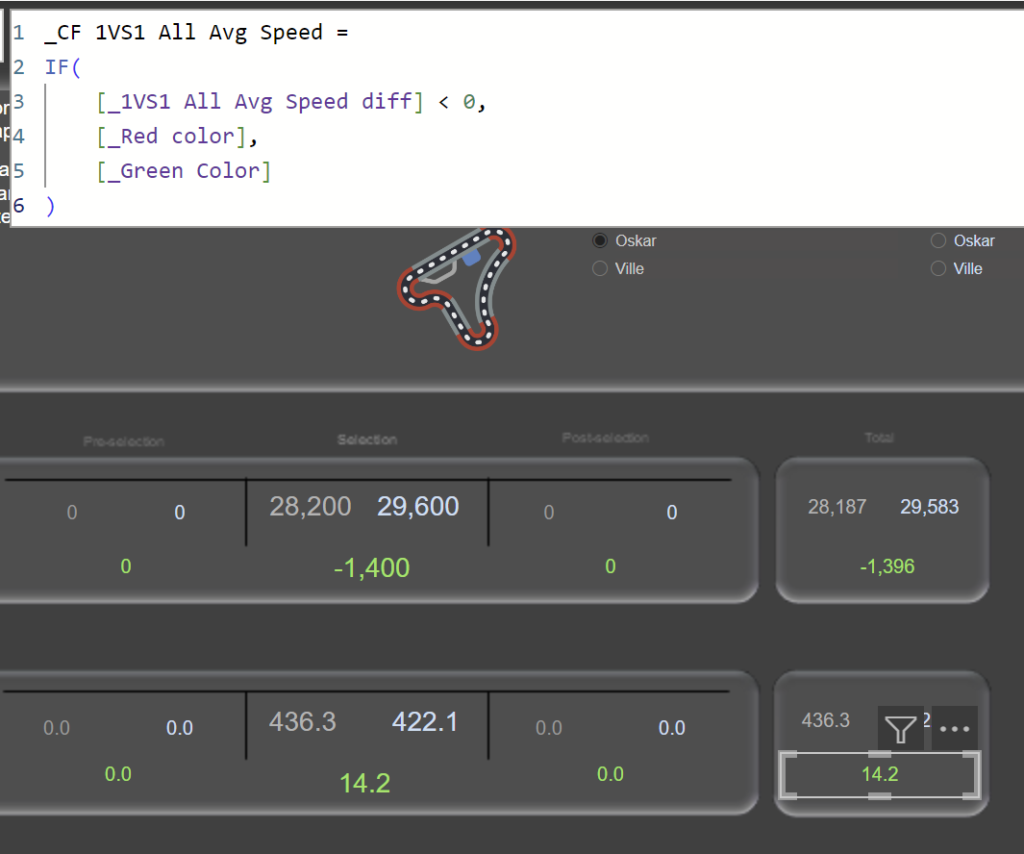
Oh and the red and green ones, there’s actually 2 measures for each of those! I have a complete measure table of conditional formatting-measures.
The average speed should for example be green if the primary run has a higher value than the compare value while the time diff should be green if the value is lower.
If you felt like this was not enough and you want to know even more details, please reach out! It sounds like we will be good friends 😀
And if you read this far, I truly want to thank you!
Cheers!