Power BI – Using What-if dates
I recently built a price development function inside a Power BI report for a customer by using What-If parameters. To be fair, I usually don’t add what-if parameters in my reports since they tend to have enough data and available columns for slicers as it is! Adding possible outcomes on what is many times already complex datasets might render my clients completely grey haired. Usually when demonstrating this feature, I simply go with the built in suggestion. A whole number, 0-20 and increments by 1. The exception is when I want to simulate percentages since you would then go from 0-1 and increments of for example 0,01.
In the case above I was going to dates though! And I stumbled upon something that might be worth sharing so here goes!
Creating a What-if Parameter
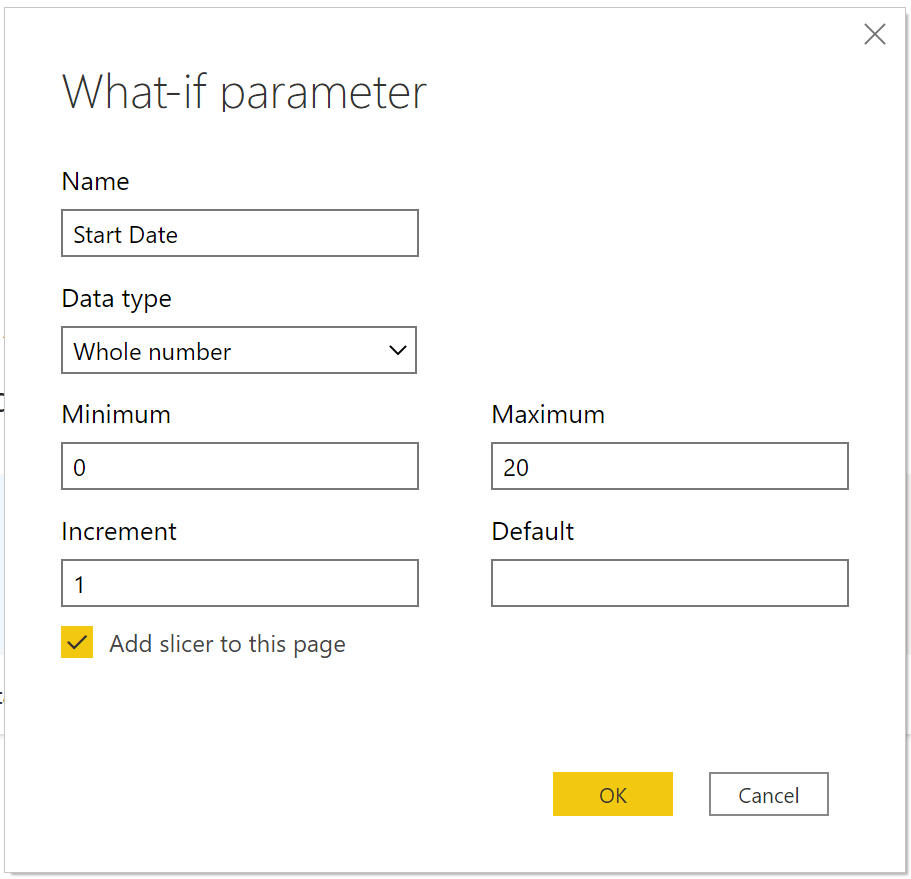
Start of as you would normally do. Go to Modeling and create your New parameter.

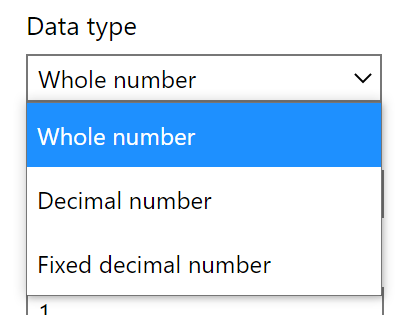
One might be temped to simply set the typ to Date, but one would be disappointed. Your only selection available is numbers, like so.
On the plus side, moving forward is super simple! Simply click OK without making any other changes than the name for your new parameter.
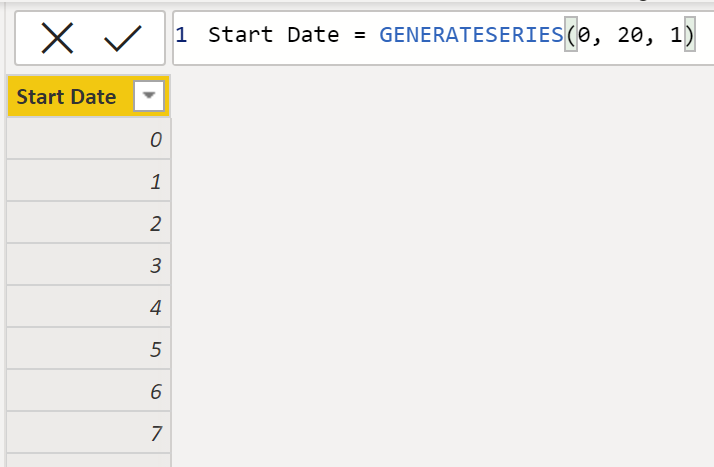
This will put a slicer on the page you’re at and create a new table with to rows. One is a column and the other is a measure. By selecting the column from the fields-list you’ll see the formula for creating the what-if parameter.

You can also go into the data view to look at all the available rows!

The what-If parameter also has a measure and this is what we’re really after! This measure will show us the selected value from the column. If we want to visualize something on the page, this is the field we’ll be using.

Converting the parameter into dates
Next step is to convert our column of whole numbers into dates. Let’s first change the values into something that is actually represented as dates!
By selecting the column from the fields-view, we can see the formula. We can see that the series start on 0, goes to 20 and is incremented in steps of 1.
We could only fill in actual numbers before, but now we have the power of the formula bar!
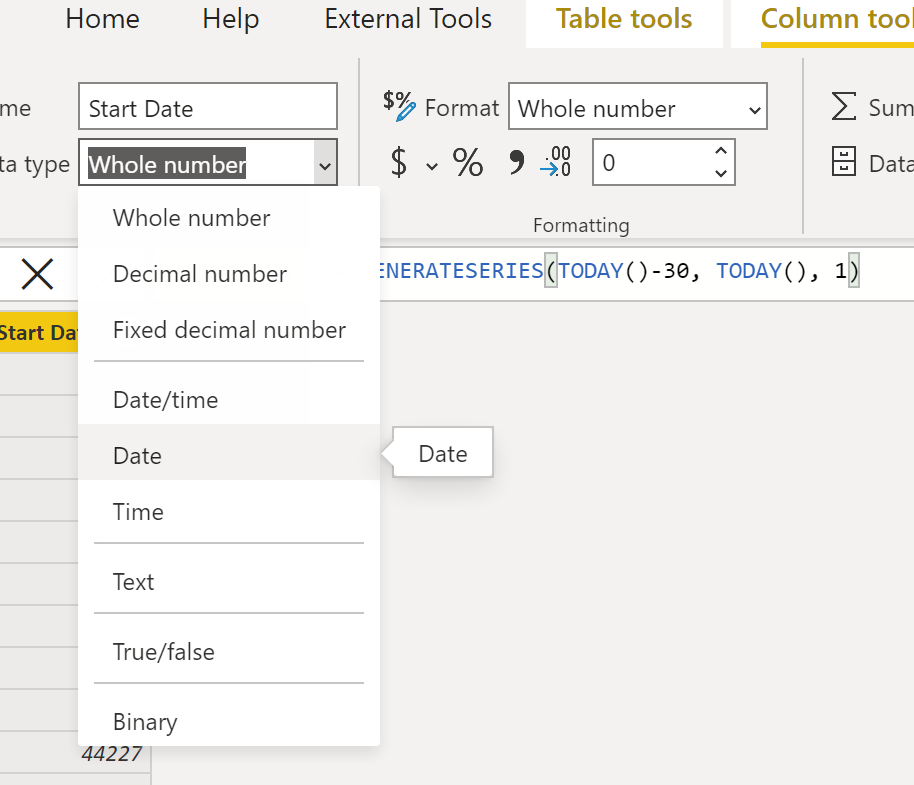
We might for example use the “Today()” formula, that will give us the whole number representing today. We’ll start with 30 days ago and go up until today like this.
(In Power BI, like in Excel, a date is represented by number of days since 1900-01-01. 1 whole number = 24 hours. By incrementing by 1, we’ll have one day per row. Increment by 0,5 and you would alternate between 12:00 and 24:00 each day)

Interestingly enough, we’re now able to set our column as date, even though it couldn’t be done in the previous window when creating the parameter. Go ahead and do just that!
(remember to also set the format for your measure since that’s what we’ll be using to visualize stuff)
This is great, right! Now we can select dates from our what-if slicer list and it’s going to give us the date as a call out value!

Using a date slicer
Using a list of days is fine. When you have 30 of them. If you would like to go back, let’s say 2 years, then your list would consist of 730 rows! Few people have the patience to scroll through such list in search for their specific date.
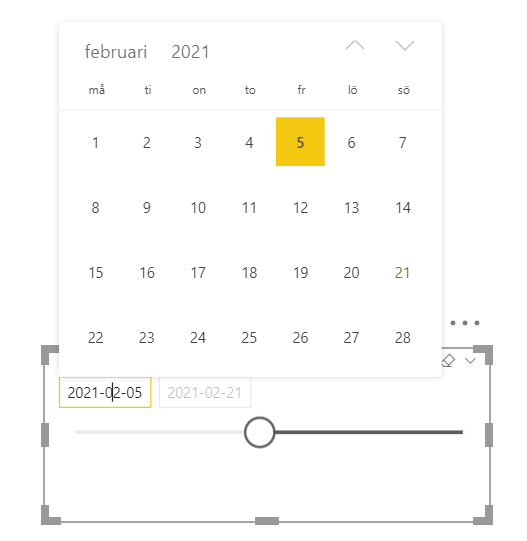
The solution is of course to change your slicer type into something that uses dates, like “After” in which we can select a starting date like this. Clicking the box of the date gives us a nice looking calendar as well!
The issue is. This breaks our call out value. What was once a nice date has turned into a blank nothing of nothingness.

The reason for this is our measure. It’s set to be the selected value, but we’re no longer selecting one value. We’re selecting any value that is after whatever we selected in the slicer. That’s lot’s of values!

The solution is to change the SelectedValue to MIN, so that we will always filter out the lowest available value, or in this case the earliest available date.
Start Date Value = MIN('Start Date'[Start Date])
If you on the other hand wanted to select the highest value from your slicer, you’d go with the “Before” option and of course instead of MIN, go for MAX in the formula above.

There it is! You are now ready to create a bunch of these what-if parameter if you for example want to create sets of periods. For the cost price development tool, I created 4 different what-if parameters:
- Start Date Period 1
- End Date Period 1
- Start Date Period 2
- End Date Period 2
You can even play with the formula field here if you want to restrict the first date on period 2 to not be earlier than the end date of period 1 for example.
Cheers!
Yay google is my queen assisted me to find this great internet site! .
Only wanna comment that you have a very decent internet site, I love the style and design it actually stands out.
I’ve read a few good stuff here. Certainly worth bookmarking for revisiting. I surprise how much effort you put to create such a fantastic informative website.