Streaming datasets in Power BI
I usually try to add three perspectives in my Power BI Reports. Three aspects I find that Power BI is really god at visualising:
- KPI
- Trends
- Details
I will go into details on this in future posts, but for now let’s just say that these three pillars are mainly used to hold up my reporting roof. That is, as long as I have direct queries or a downloaded dataset! The exception comes when introducing the streaming dataset and with it, real time data visualization!
How can this be used?
Well let’s make a real life example, shall we. Back in 2019, before the Covid-19 pandemic forced pretty much all events to be held digitally, I held a Power Platform pre-day at Tech Days with my colleague Magnus Göransson. We wanted to evaluate our session that spanned over about 8 hours but we didn’t just want a 5 out of 5 for the overall session. We wanted to know what was good and what was bad! We created the digital applauder! This was actually just a PowerApp in the PowerApps portal. At the beginning of our session, all attendees opened the website to the portal and found an input box where they could add -10 up to 10 with increments of 1. They could for example fill in -5 or 7 depending on how many negative or positive applauds they wanted to provide.
On a screen, we then visualized a graph in real time showing how we were doing. Any time we spoke of something good, the lines went upwards. When we spoke of the new licensing that some didn’t exactly love, the graph reflected it and we could pinpoint what to elaborate in future sessions. The graph was also used during our 1 hours session on tech days.
How do I set this up?
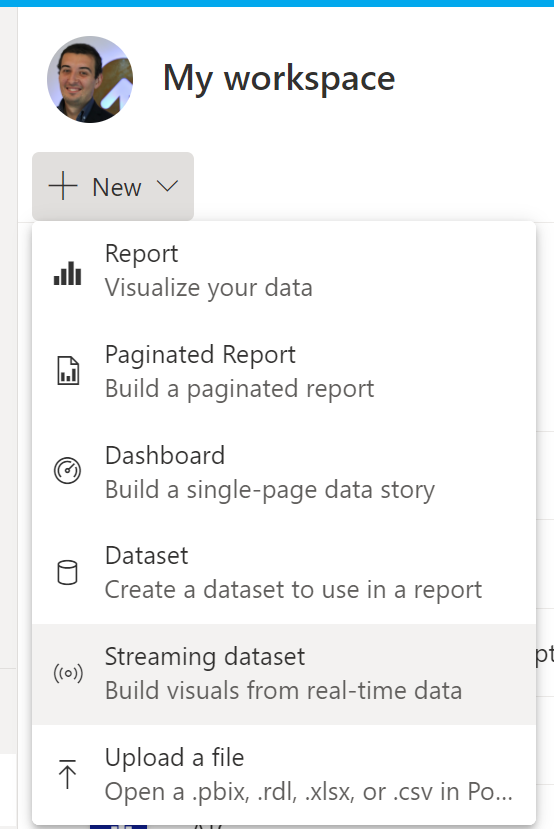
Simple! Go to apps.powerbi.com (everyone’s favorite URL). Select “New” and chose Streaming Data set.
Select API (this is actually pre selected so just hit Next):

Now let’s make some choices for our dataset. We need to give it a name and some columns. This is the start out view:
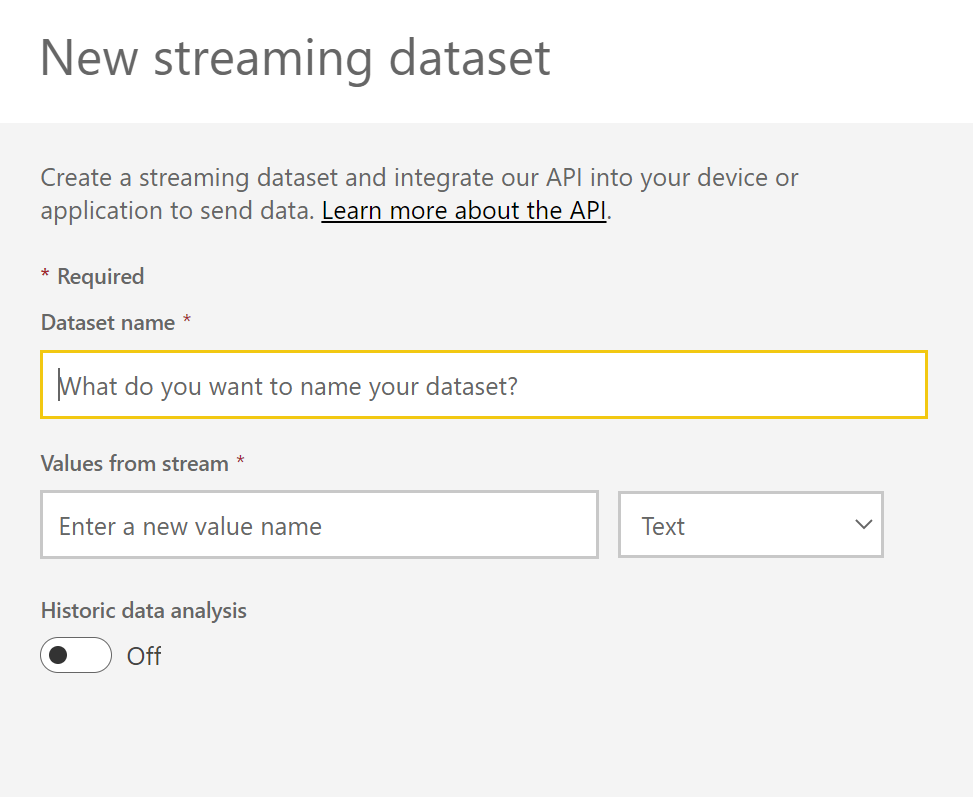
Here we go! I’ve named the dataset and created 4 columns by entering value names and selecting a type for them.

I can now add rows with a name and category as text, an amount as a number and a modified value as date. By selecting Historic Data analysis, I’ll keep rows older than 1 hour.
My streaming dataset is created and I get a push URL, that is a URL to add new rows to my dataset with. I also get some pre set code for PowerShell and I can actually push new data in there using a Flow in Power Automate, even though it isn’t seen in here right now.

Let’s say we push in some data looking like this:
| Name | Type | Amount | Modified |
| Surface Book | Computer | 5 | 2020-01-09 |
| Surface Pen | Accessories | 5 | 2020-01-09 |
| Power BI Mousepad | Marketing | 10 | 2020-01-09 |
| Power BI Sticker | Marketing | 100 | 2020-01-09 |
Whenever we take something from our stock, we push a new row with a -1 or whatever the amount we took from stock. When we add to the stock we do it the same way but with a positive amount.
By simply adding the sum of the amount by Name, we’ll then get the current stock. Doesn’t matter if we add or remove hundreds or thousands of rows every minute! We’ll be able to get a real time view of the current amounts of Surface Books in our stock.
To start working in Power BI with your dataset, go to Power BI Desktop and simply open a Power BI Dataset as your source. Find your dataset and select it.

Note that you cannot add more sources and combine them with your streaming dataset, nor can you create new columns in here. You can however create a new column at apps.powerbi.com!

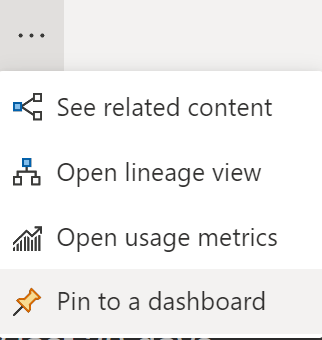
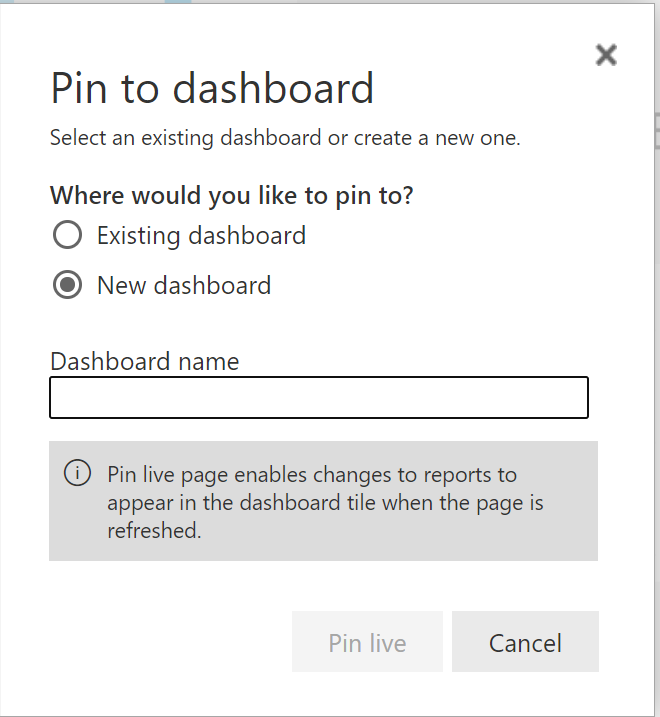
When you’re done creating your report, publish it to the Power BI Service and from there, pin the entire Report or each viual to a dashboard! This will make your report update in real time when viewing the dashboard.
For more information on Streaming datasets please visit these sites
https://docs.microsoft.com/en-us/power-bi/connect-data/service-real-time-streaming
What i do not realize is in truth how you’re now not really a lot more well-favored than you might be right now. You are so intelligent. You understand thus significantly relating to this subject, made me in my opinion believe it from numerous numerous angles. Its like men and women don’t seem to be fascinated unless it’s one thing to accomplish with Woman gaga! Your individual stuffs great. All the time deal with it up!