Trackmania Analyzer – Part 2 – Data Transformation
This is the 2nd part of my Trackmania Analyzer series and it covers technical aspects of how the data is loaded and transformed in Power Query.
You can read the other posts here:
- https://www.villezekeviking.com/trackmania-analyzer-part-1-using-the-report/
- https://www.villezekeviking.com/trackmania-analyzer-part-3-calculations/
The replay information is stored in .GBX-files. When transformed into JSON there’s a section for the Ghost in which sample data can be found from the run. The game samples data every 50 Ms. I won’t cover every single part of the data transformation in this post but rather some parts that might not make sense without documentation. (Or just stuff that I think is a pretty neat way of solving stuff).
The next headlines are each a query of the report.
Fct Racer PlayerInputs
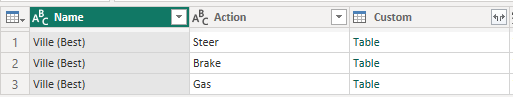
The Inputs in the replay-file is stored by closest 10 Ms. By default, the table show each Total millisecond that an action was changed as you can see from this sample.
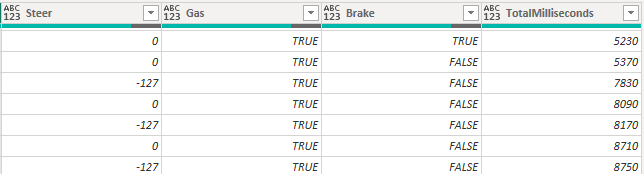
The thing about this sample is that your actions are columns and therefor you might have repeating actions because something else changed. Note that Gas is True throughout the whole sample. I wanted to have one line per unique action and have all the possible actions as rows, not columns. I also want to know when an action was initiated as well as ended.
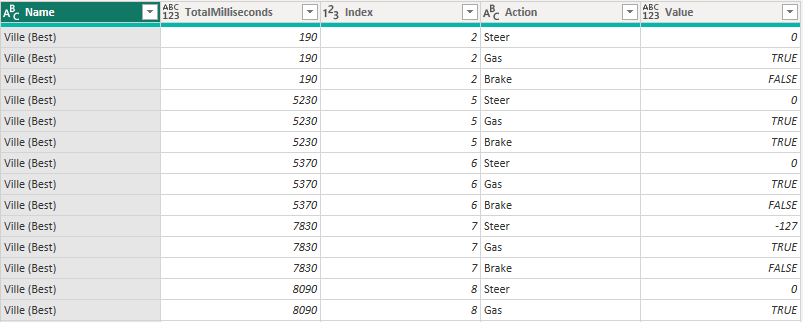
To get this, I first add an Index to know what row comes in which order (sorted on TotalMiliseconds). The Name-column just shows what JSON-file the data comes from.
If I just added the TotalMilliseconds something ended in this table, I would have so many redundant rows! It’s not relevant to know that I throttled from 190 MS to 450 MS and then again from 450 MS to 890 MS. It’s enough to know 190 MS to 890 MS in this case.
Step 1 is to remove all these redundant rows. I want to see if the next row for the same action is the same as the current one, then the next one is not needed.
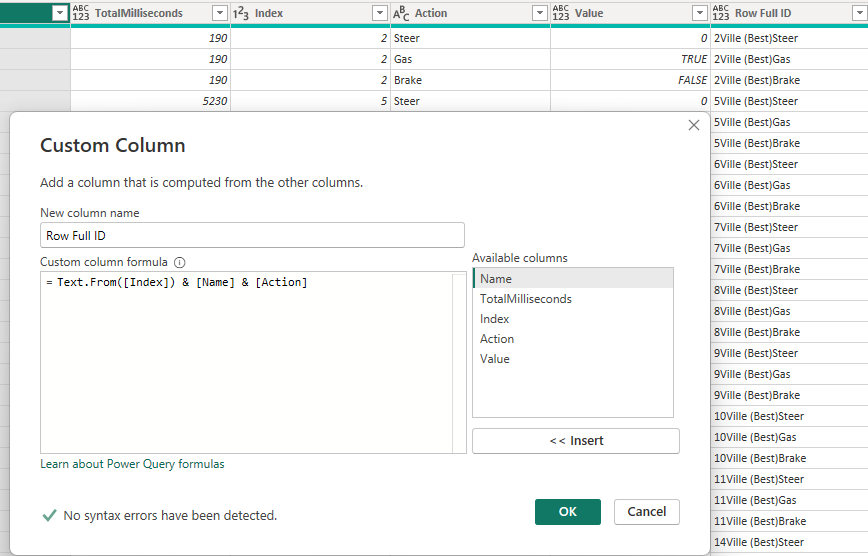
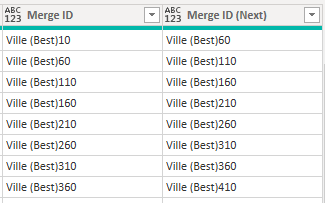
I’m adding 2 columns that include the index, name and action in the same column. The second one is however increased on the index by +1, essentially giving me the index for the next row of this action.
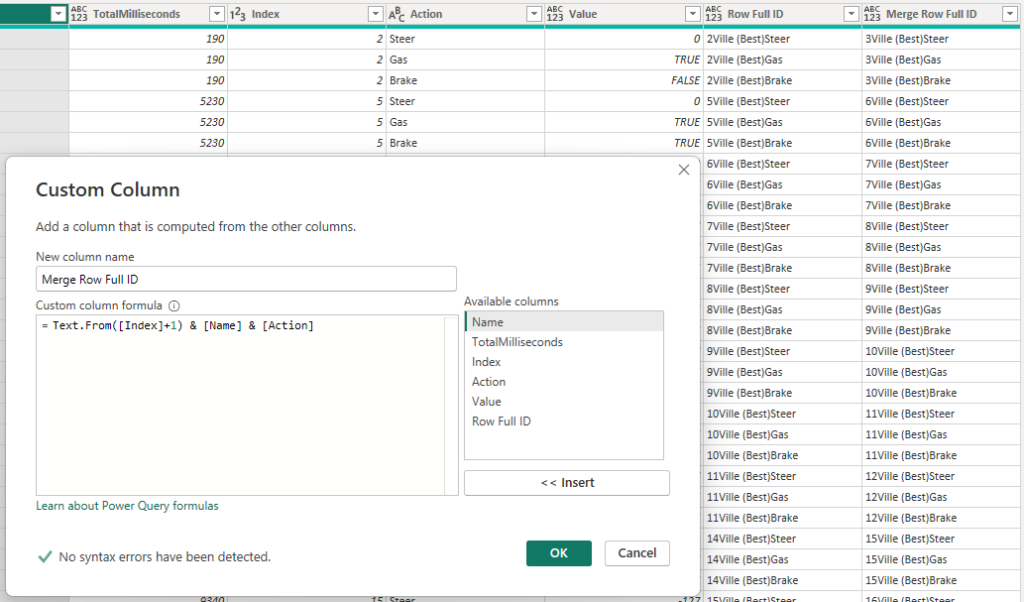
After this, I merge the table with itself on these new columns.
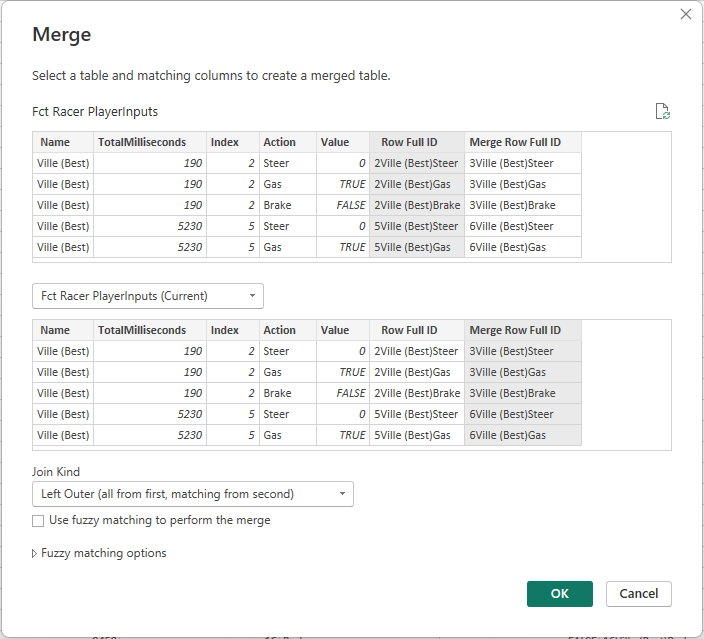
I then extract the value as “Prev.Value” as a new column. Through this maneuver I now have the value from the previous row and now I’m able to make simple comparisons.
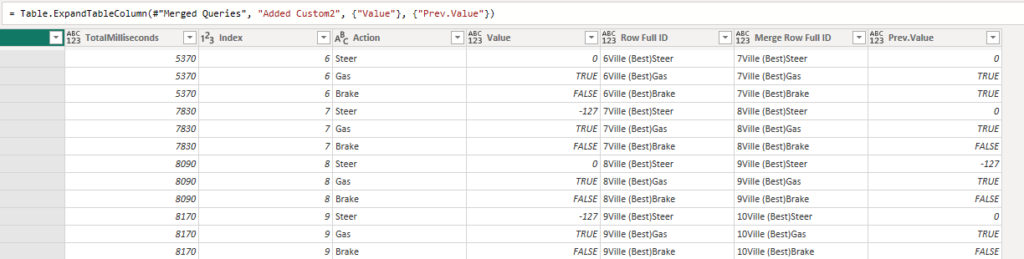
Now it’s just a matter of matching the values. If the value of this current row is the same as the previous row was, I have no need for it. It’s redundant as it just gives the same value I already have. If the value is different, however, this row has actual value and should be kept.
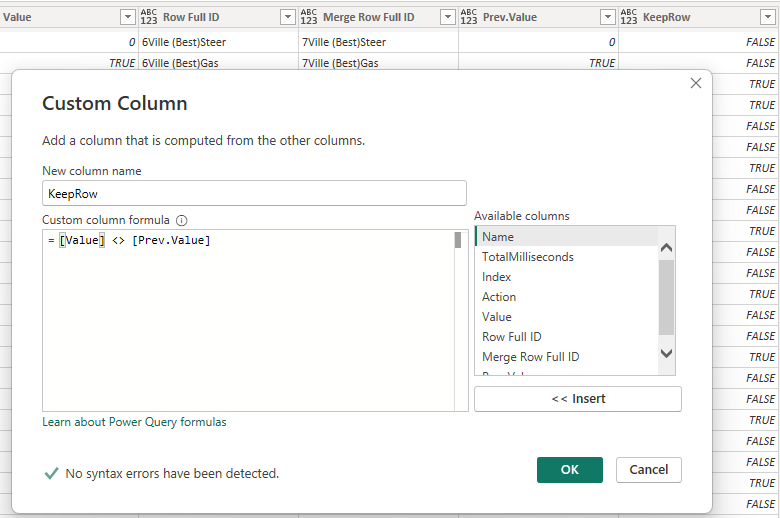
I’m then filtering out the rows that I need to keep and I clean up the columns I created to get back to square 1, but this time I don’t have any redundant rows!
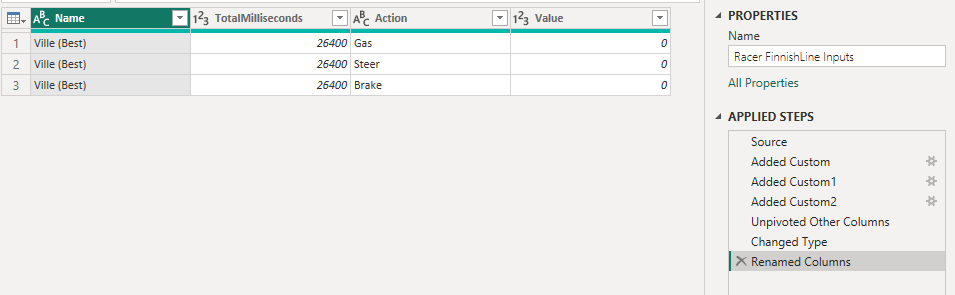
At this point I want to make sure my last rows for each action is at the finish line to get a correct duration of the second last action. To get this, I created a separate table with the finish time as TotalMiliseconds and added a row for each action. When the table looked like this I just appended the query into my Input table to get the rows added into my data.
This next part is a little bit tricky. I sort all my rows on TotalMiliseconds ascending and then I group the data based on the action. I want a new Index column but I want the index to be per action.
After grouping the data, my table looks something like this.
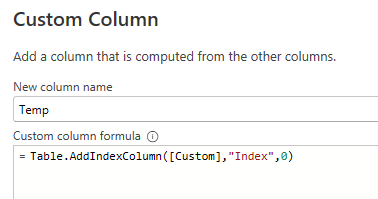
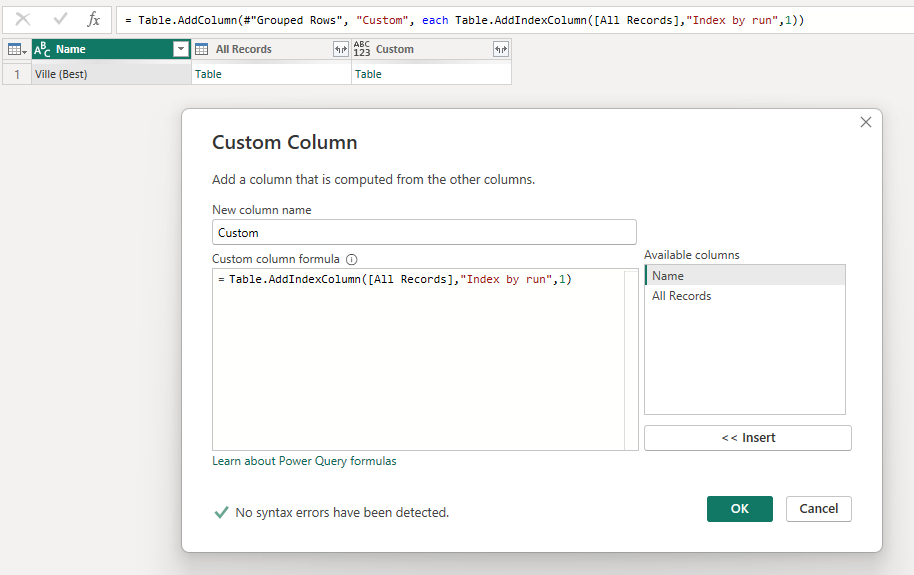
I now add a new column that is a copy of the Custom table column, but in the new one I have an index column inserted in the Table.
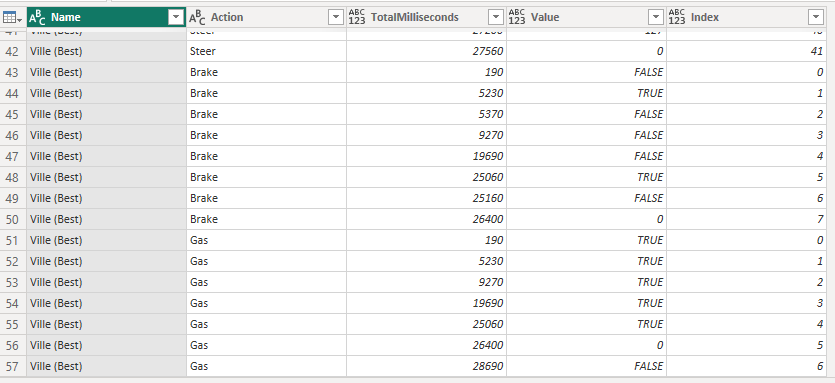
After expanding the new Temp column and cleaning up the columns, I have an Index that restarts for each action! Hurray!
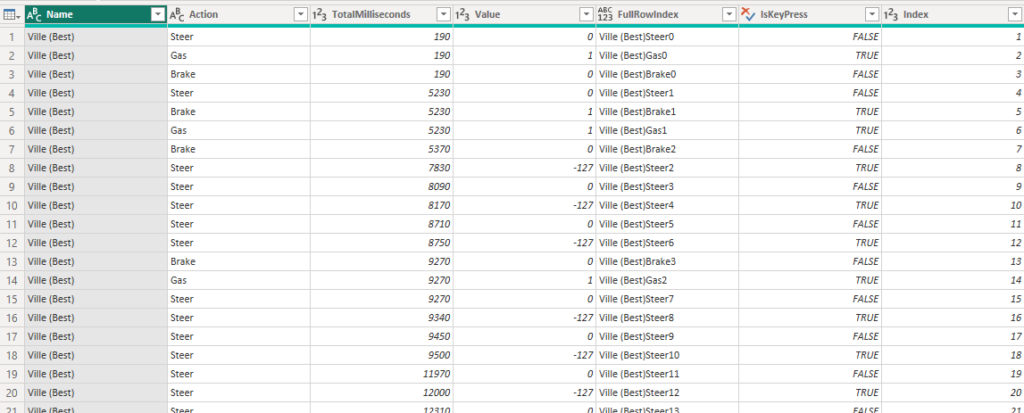
Issue is that this value is not unique. I have Index 1 not only for Gas, Brake and Steer but also for each Name (file) in the report! To sort this out, I create a new Index column that includes name, action as well as the index. This gives a distinct value for each row! I also add a column that explains if the action was pressed or released.
Oh, and I finally add the last index just to have an ID on each row as a number. My table looks like this!
The End TotalMiliseconds as well as the duration for each row is added as calculated columns using DAX later on.
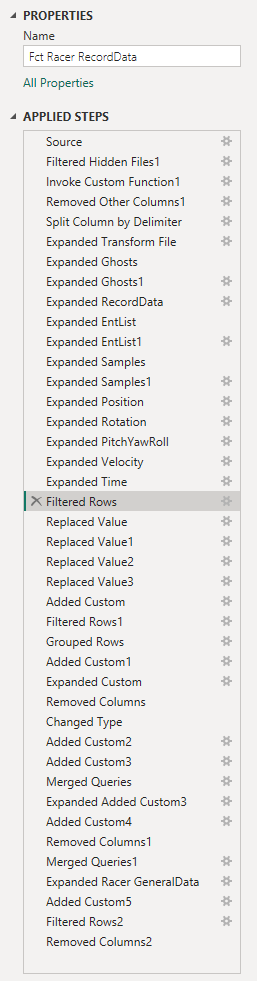
Fct Racer RecordData
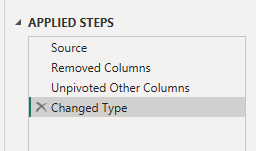
I will start this explanation here, at Filter rows in the M code/Applied steps. The reason is that each step before this is just to expand the data in the standard table.
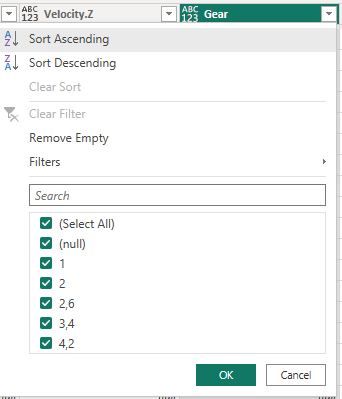
For reasons beyond my comprehension, the game stores gears as decimal numbers instead of whole numbers. Step one is to replace these values to gear 1. 2. 3. 4 and 5.
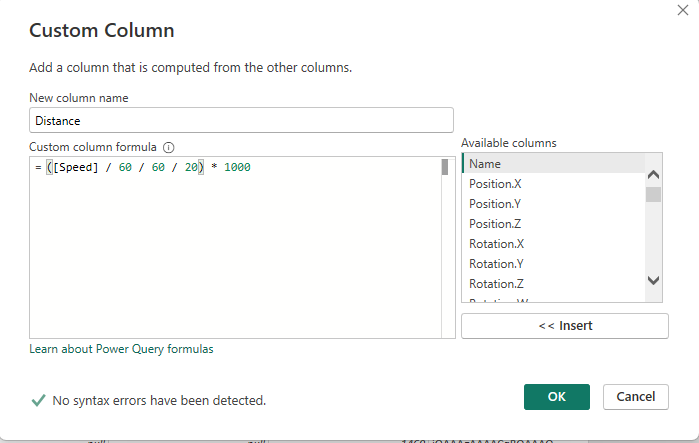
Next I’m creating my own Distance-column. The sample data doesn’t have distance but since I know that each sample represent 50 MS and I know the speed at each sample, I made up my own Distance and put it into the sample data. I named it Distance. In Trackmania you don’t have KM/H, you have “Speed”. You run at 300 speed, for example. For this reason, it made no sense to create a distance like in meters or kilometers. Just Distance.
Note that this distance will be calculated relative to the car, not the track. A car that swirls all over the road will have traveled a further distance than a car that runs in a straight line. This is very important actually, because there are really only 2 ways to get the fastest time on a track. You have a high average speed and a low distance driven. Adjust these measures to get a better finish time.
After that I add an index to each run, using the same table-trick as above.
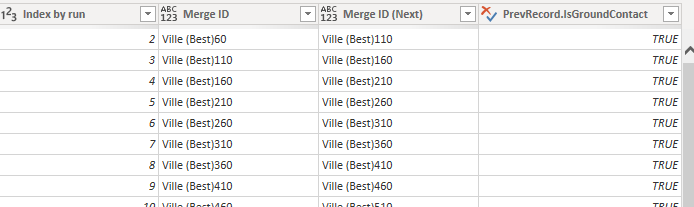
I also make the same type of ID columns as the previous query, that looks something like this:
This way I can merge the query with itself and extract the previous runs value for “IsGroundContact”.
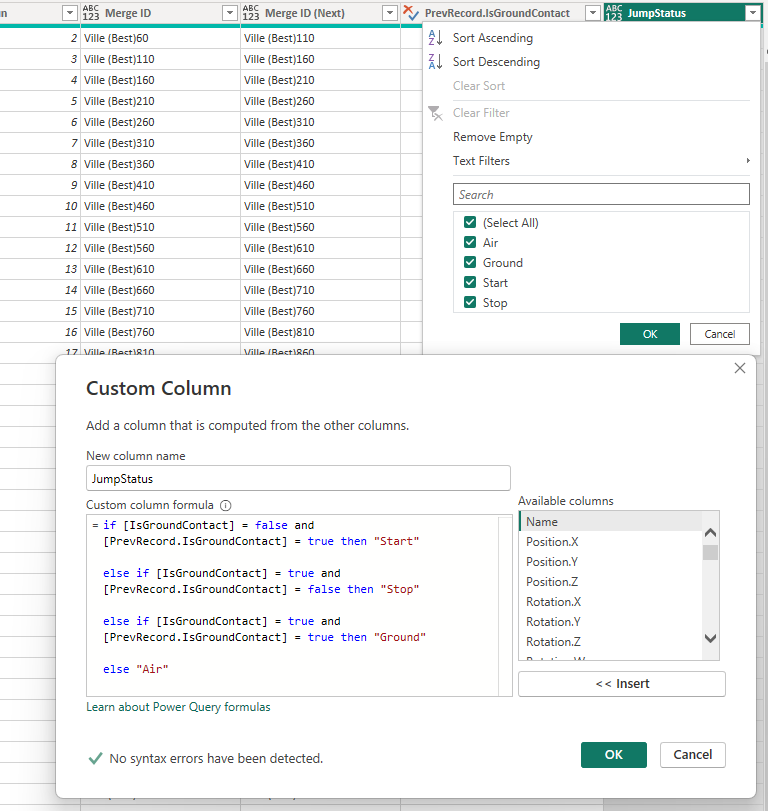
With this information, I created the column “JumpStatus”. IsGroundContact only tells us that the car has or doesn’t have contact with the ground, but I wanted to know at what exact sample did the car loose contact and at what sample did it regain contact again, as well as how many samples are on the ground as well as in the air.
Ironically, this is not actually used in the report, but my idea was to create a measure that tells you how many jumps you’ve made during your run based on the start and stop-value.
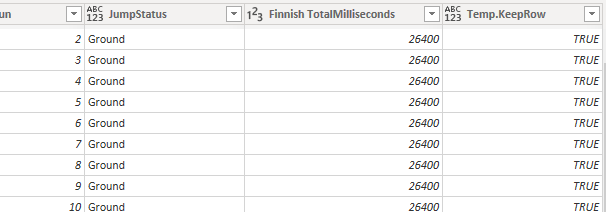
I also spotted something weird. Sometimes the samples would exceed the finish time of a run. It makes no sense to keep data after you’ve crossed the finish line so I remove these rows by merging the table with another query, that holds the finish time. Each sample row now have the finish time as well as it’s own “TotalMiliseconds”-column that shows when this record was sampled. By a simply if-statement I check if the samples TotalMiliseconds is above the actual finish time and if see, the row should not be kept.
Finally, I clean up the columns that I no longer need after filtering the data.
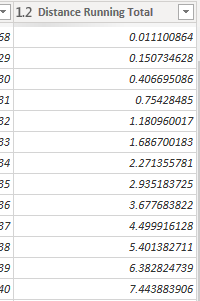
I’m the report I have “Distance Running Total” and that needs to be a value in a column, not a measure in DAX, because I’m using it with a slicer on the Graphs-page. Here I’ve used a solution from Gorilla.bi that you can check out here! https://gorilla.bi/power-query/running-total-by-category/
There are more stuff being calculated with this table after it loads, but that’s calculated columns in DAX and I’ll cover those in another blog post.
Fct Racer RecordData Graphs
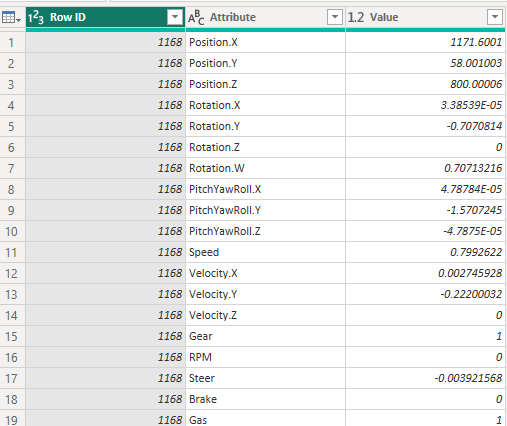
This query has very few steps. It references the RecordData query, removes columns that does not have values (like text or true/false) and finally it unpivots everything except the Row ID.
This creates a table with about 50 times more rows and only 3 columns, compared to RecordData. The reason? Well in the report, on the graphs page, you can select what kind of metric to show in each graph and that’s because you can select the attribute from this field!
Dim Runs (and Dim Runs (Compare))
These two queries just hold the name of the run, the ID and the total miliseconds it took to cross the finish line. This is the dimensional table of the runs and it’s used to put the name of each run into the visuals of the report.
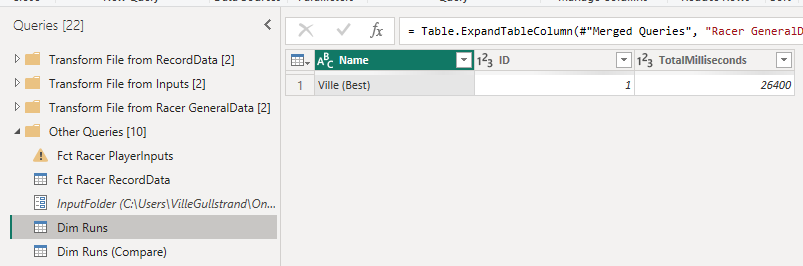
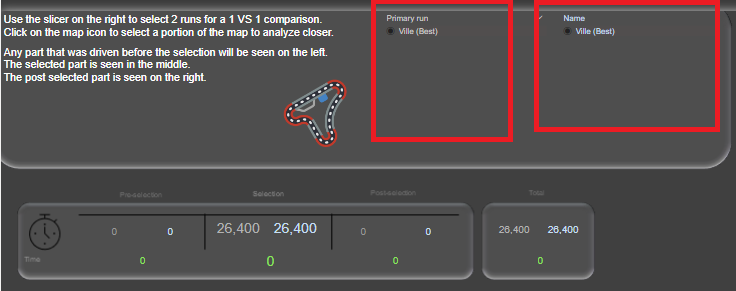
The reason I have two of them, where one is named Compare, is because of the 1VS1 page of the report. I have 2 slicers where you select runs. The first is the Dim Runs and the second is the Dim Runs (Compare). This way, I’m able to calculate the diff value between the primary run and the secondary run even though the data is stored in the same facts table. I’ll explain how that works in another blogpost though.
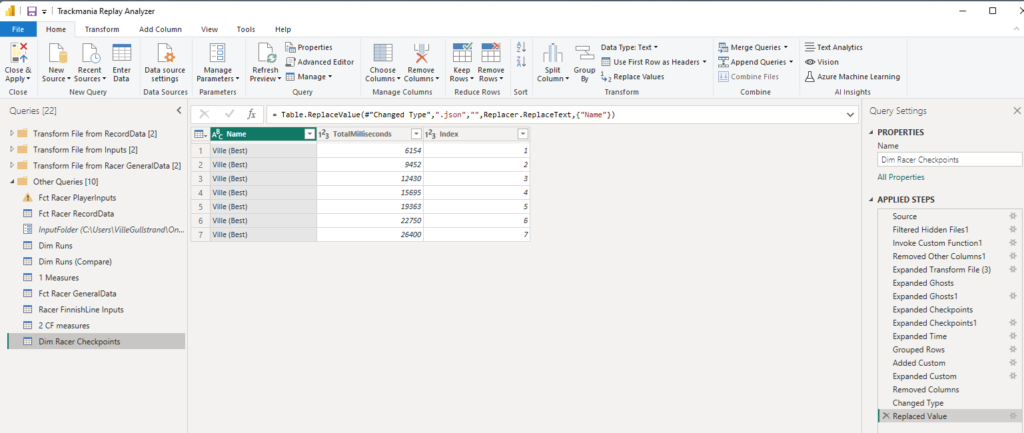
Dim Racer Checkpoints
The last table is just loaded as is with an added index per run. It show each total milisecond that the run was clearing each checkpoint and it’s used on the Leaderboard page for the ribbon chart as well as the table.
This table is also used when adding the Checkpoint section in the sample data, but again that is using a calculated column with DAX so that too is for another blog post.
And that concludes part 2 of the Trackmania blog posts! Now you know not only how to use the report visually but also how the data transformation was done in Power Query.
I’m 100% sure there are many many ways this can be done better and more optimized. I’m looking forward to the feedback on how to improve this part!
Cheers!