Using Power BI for business cases of Servicedesk data
From personal experience, I’d say that the Servicedesk is most likely the most data driven group in IT. Everything is measured, especially the ticket system. How many cases do we have, how many requests versus incidents, who have completed the most tickets last week, last month, this year… The list goes on and there are a ton of best practices. However I’m not so sure all of them are as much a best practice as it’s just “how we have always done it”. The amount of time it takes to complete a ticket for example. We usually measure it because it’s easy to measure, but I think we’ve gotten it backwards there and in this blog post I aim to explain why while also giving you a bunch of tips on what can be measured in Servicedesk data and of course; Why!
I recently made acquaintance with a Servicedesk manager with a big interest in Power BI and he was friendly enough to provide me with anonymas data to make some examples on for this blog post! My colleague Mathilda have made the layout. Let’s get started, shall we?

Our demo data has about 250 000 cases in it and 130 780 of those where handled by the First line group. The average handling time in Hours is 46,5 hours, we have the backlog of the last month and finally an overview of when cases are created of closed during the day. Each of these boxes are actually buttons that will take us to detailing pages for drill downs!
Let’s look at the average handling time first.

In here, we have the amount of cases based on categories as well as handlers. I’m using the Office-hours calculation to only calculate the amount of time that the case was opened during office hours.
By drilling down on the categories and looking at average handling time (as low as possible), amount of cases and sum of handling time (as high as possible) we can find a few examples of case types where we spend very little time completing the case, but we do it so often that it still takes a significant amount of time!
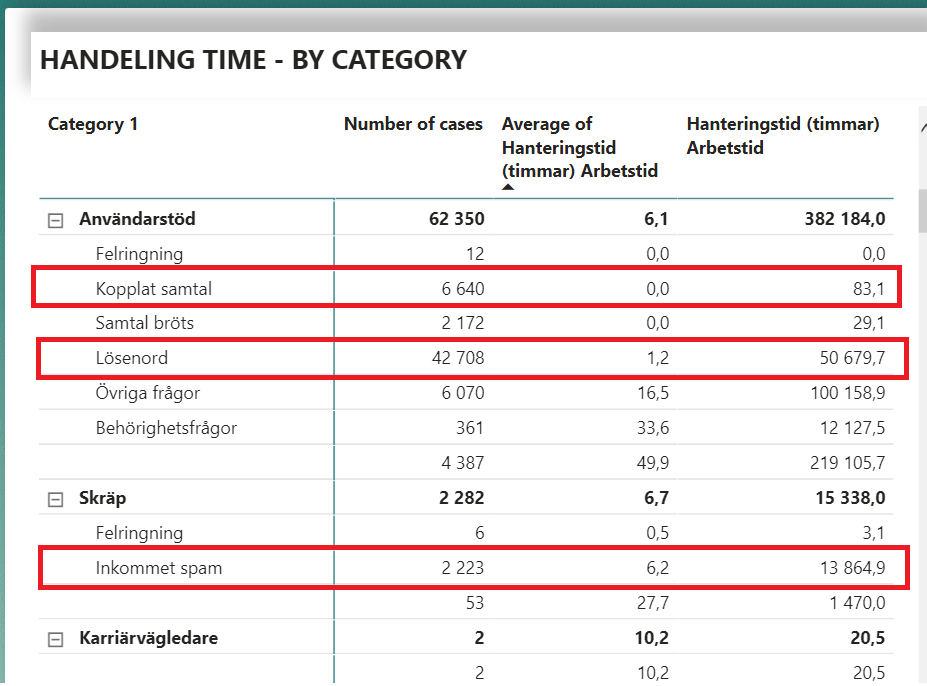
The handling hours is not effective time though. It’s just the office hours from the creation of a case until it was completed. We can therefor not say that we’ve spent 83 hours transferring calls like the first highlight up there. We can however say that for both passwords and incoming spam, people in the organization have been waiting for 50 000 and almost 14 000 hours to get help!
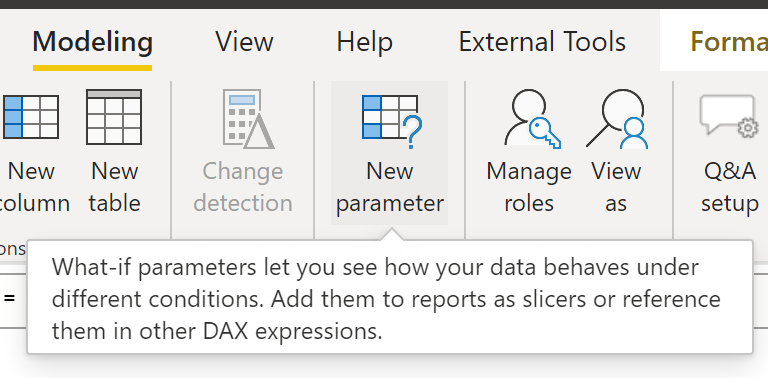
This is a great scenario for a What-If parameter! You can create it under Moderling -> New Parameter.
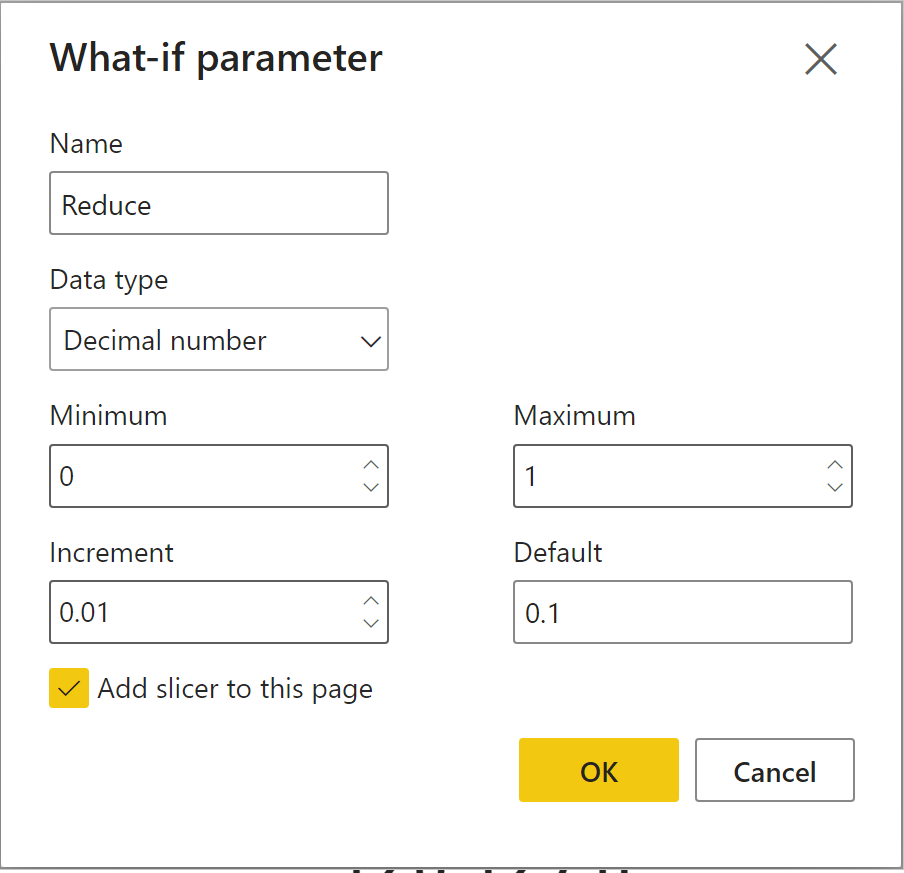
I’ve created one called “Reduce” like this. It will be used to calculate how much time would be saved in the organization if we could reduce a percentage of cases.
I also created one for the hourly cost like this:
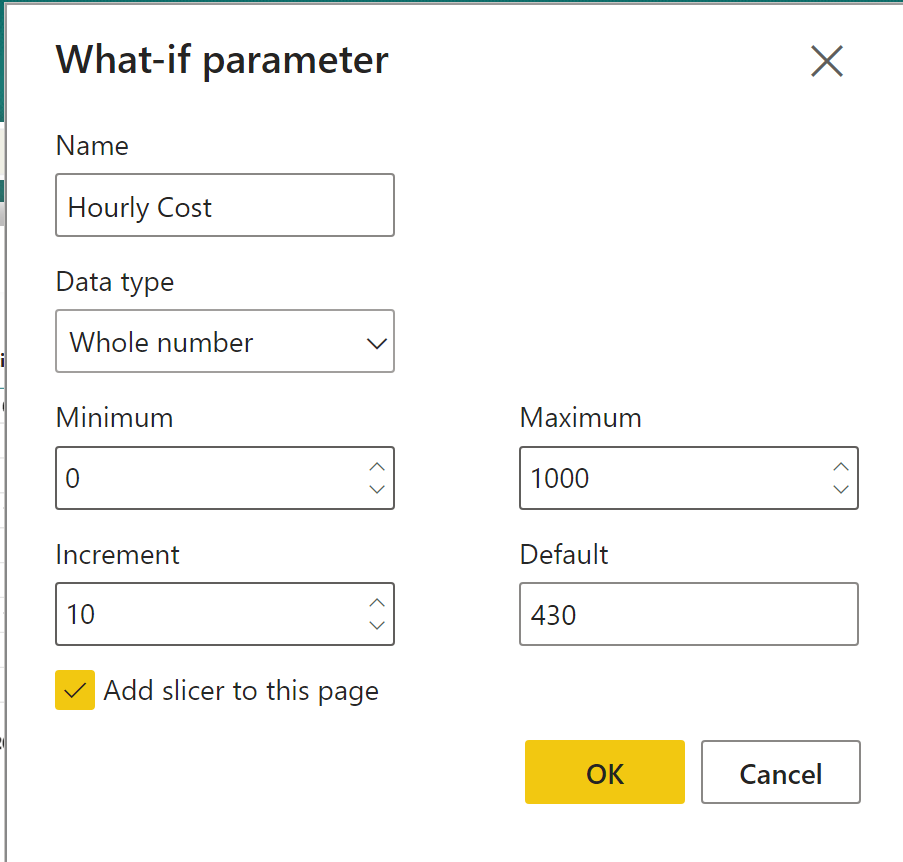
Now let’s create a measure that makes use of these what if parameters.

_What_If Reduced Time = 'Reduce %'[Reduce % Value] * SUM('Alla ärenden'[Hanteringstid (timmar) Arbetstid])I multiply the selected value from my Reduce-What-If parameter with the sum of hours spent on cases during office hours. Let’s also multiply it with the hourly cost like this:
_What_If reduced cost = [_What_If Reduced Time] * 'Hourly Cost'[Hourly Cost Value]The cool thing about measures is that they are calculated in the context they are in. This means that if I select the passwords from the list above, we’ll se that 31% of the 50 000 hours select is 15 700 hours in possible reduction. For an hourly cost of 430 swedish crowns we would save about 6,7 million. This in return could be used in our business case! If we look into a self service solution for passwords and we feel confident that it would reduce our cases by about 31%, the solution would be beneficial as long as it costs less than 6,7 million SEK.

Here’s another example. In this I’ve select inventory changes:

In this scenario I’ve said that we will only reduce the amount of changes in the inventory by 10% and for each hour that the inventory is incorrect it costs the organization about 150 SEK. Again, this is not the time we actually spend changing the inventory, but rather the amount of time for the case to be opened and thus, this was the total time that we know the inventory was incorrect. The consequences could be anything from people traveling to get things that are not actually in stock or failing budgets due to outdated equipment being set as active.
Let’s say this is about a computer or phone inventory. Perhaps some of this could be automated using Endpoint Manager and/or Intune? What we’re saying here is essentially that if you could reduce 10% of the time these cases are opened for a cost of 150 SEK an hour, you could spend over 4 000 000 SEK to get there!
Final example is about disruption of the network.

In here I’ve selected disruption of network services. Assuming that the case was created when the disruption began and was closed at the time of the disruption being solved, if we could reduce these issues by half and each hour where people don’t have access to the network costs 700 SEK then arguable you could spend 20 million Swedish crowns on stabilizing the network and still save money on a 9 month period. Wow!
Another example of how to use this data is to simply look at cases completed by handlers that took less than 1 hour of Office hours. By filtering so that we only see cases that were opened for an hour or less, we can see that Kenneth is our number one handler in terms of completing most cases.

Selecting him in the list will show the categories on the left. We’ve already handled Password that is the first row here but the second one is network printers. We can see that Kenneth has completed almost 400 cases in under 1 hour each that has something to do with network printers. This means we should probably sit down with Kenneth for 45 minutes and have him explain this in more depth. Perhaps this is a good opportunity to automate?

I plan on creating a bunch of more blog posts in regards to measuring the Servicedesk. I’ll go into more details on things you can calculate and why. For example, I don’t think you should strive to reduce the amount of hours spent working on cases by handlers. Quite the opposite. If there are cases that you can complete swiftly, you should look into automating them or providing self services for the end users there. The cases that takes a long time to complete are the ones you need humans to solve! If you set a reduction of handling hours as a KPI, the handlers will be unmotivated to automate the things that make them actually able to reach the KPI.
More in upcoming posts! Until then, take care!