Taking control and automating your surveys
In many organizations today there is a need to collect survey data. I’ve seen numerous examples of how this can be done and most of the time it involves some kind of automated email sent out with a link in hopes of your subjects decide to deposit a few minutes of their precious time to your benefit. I’ve seen people rejoice over 25% respons rates using these types of methods.
Some years ago I was working together with a sales training company and they showed me a better way that I want to share with you today. This company evaluated every training and trainer through a small survey but they didn’t wait until after the training to collect the responses! They instead embedded the survey into the training. A typical session would last either half a day or a full day and when it is about 30 minutes left of the training, the trainer will provide all the attendees with the survey and they’ll spend 5 minutes filling it in. This is taking control over your surveys! People aren’t going anywhere, they don’t have anything else to do, they’ve literally allocated this time for the training and filling in the survey just happened to be a task within the training.
OK, Ville, great tip but why are you sharing it on your blog??
Because of the reason I was working with the customer in the first place. I was consulted on how to improve the process of collecting and analyzing the surveys as they where done using pen and paper at the time. The answer eventually needed to be written into Excel in order for any analysis to take place. Today I’ll share how you can digitalize this process by using the built in features of Office 365 + Power BI. This should be able to save many of you quite some time!
Let’s dig into it!

The overall process
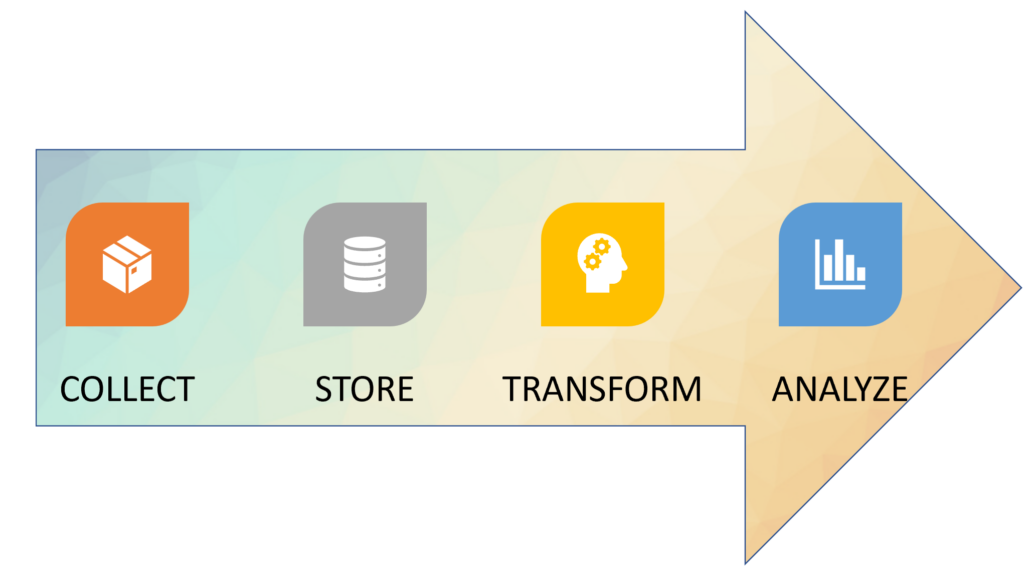
The idea is very simple. We start by collecting the responses from the attendees, then we need to store it somewhere and from there we want to fetch it to Power BI for some transformation and finally we want to present it for analyzing.
Collect the responses
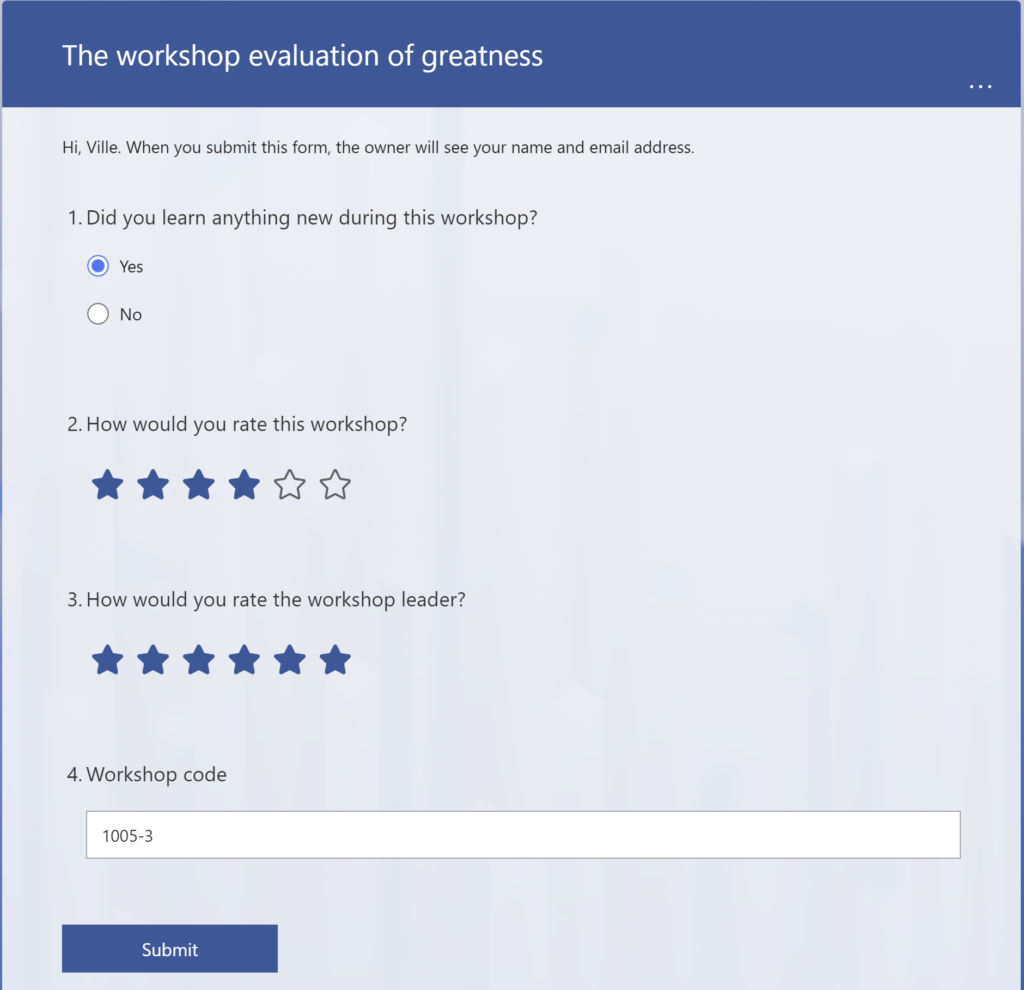
To get started, head over to Forms! Here you can create your survey with all the questions you want to ask you attendees. I’ve created this super simple form as an example for you to get the idea.
Personally I prefer to have a rating scale with even numbers (like 4 or 6 instead of 5). This way, you cannot select the exact middle but you rather need to make the choice of “was this slightly better or slightly worse than average?”.
Store the responses
Allright, so the responses are of course stored in forms and can be downloaded to Excel. If you create your form in a group (did someone say Microsoft Teams?) then an Excel file with all responses will automatically be created in the root folder in SharePoint for that group. New answers comes in automatically as well.
If you don’t like this solution, you can use Power Automate to store the responses for you in another datasource, such as a SharePoint list, dataverse or perhaps an Azure SQL. Keep in mind that SharePoint and Excel does not require licenses while creating Power Automate flows that uses the Dataverse or SQL connector will require a license.
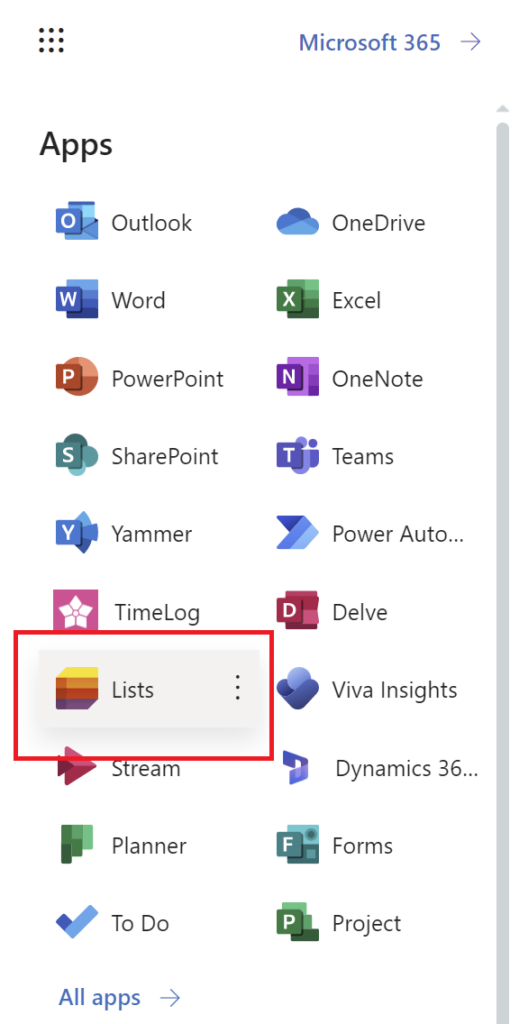
First you need to create such a datasource. A SharePoint list can be created using Lists and you can create it in your own library (OneDrive) or in a group (did someone say Teams?). You find Lists in the app menu (the waffle) in the left upper corner at office.com
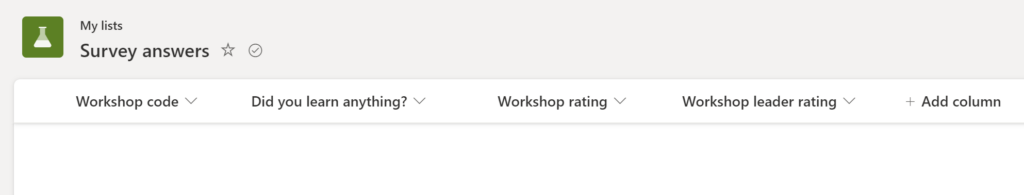
I created a list that looks like this to match the questions in my form:
So the next step would be to head over to Power Automate and create a flow, like this one!
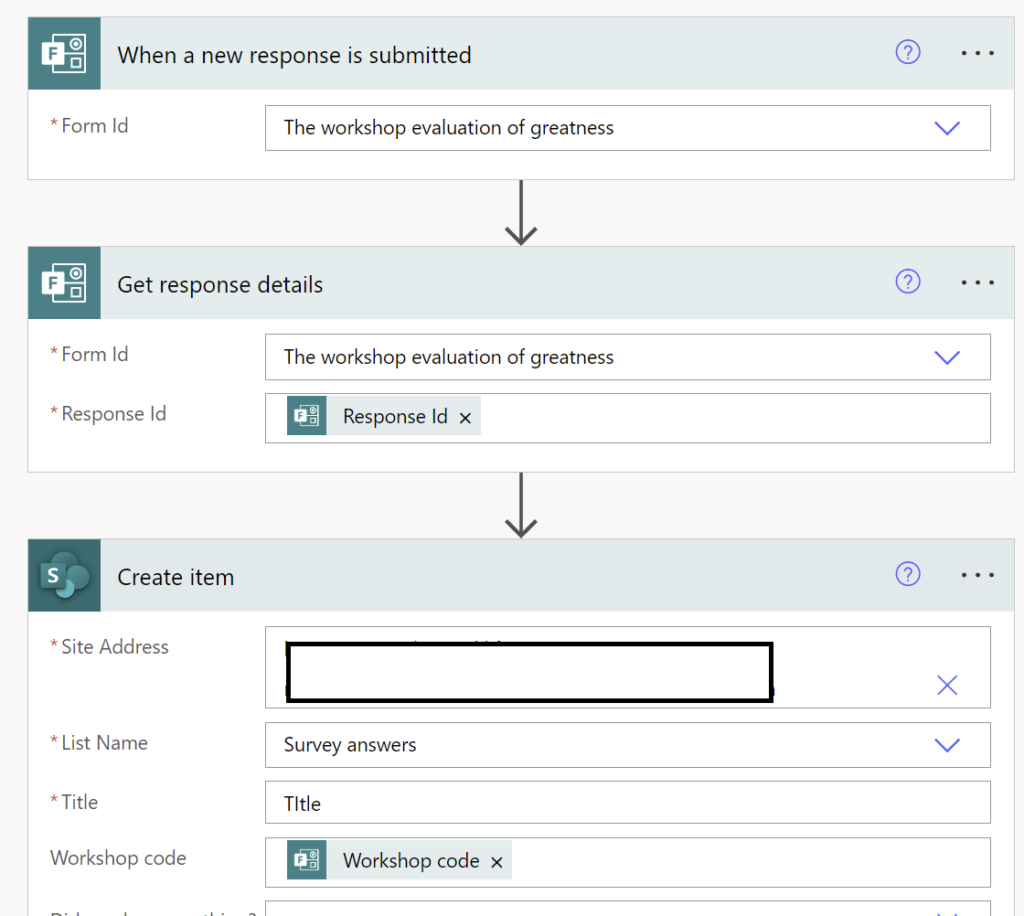
Allright so any time anyone responds to the survey, the flow will trigger and save the answer in a SharePoint list.
Transforming the data
OK now that we have all the answers in our data source it’s time to connect Power BI! SharePoint lists can hold up to about 30 000 000 records when this blog is written so it should be able to act as you data source for quite some time in terms of simple storage. Bear in mind that an SQL would give you other advantages, like being part of a data warehouse where you have lots of other useful data or the fact that you can use DirectQuery to get much more up to date data.
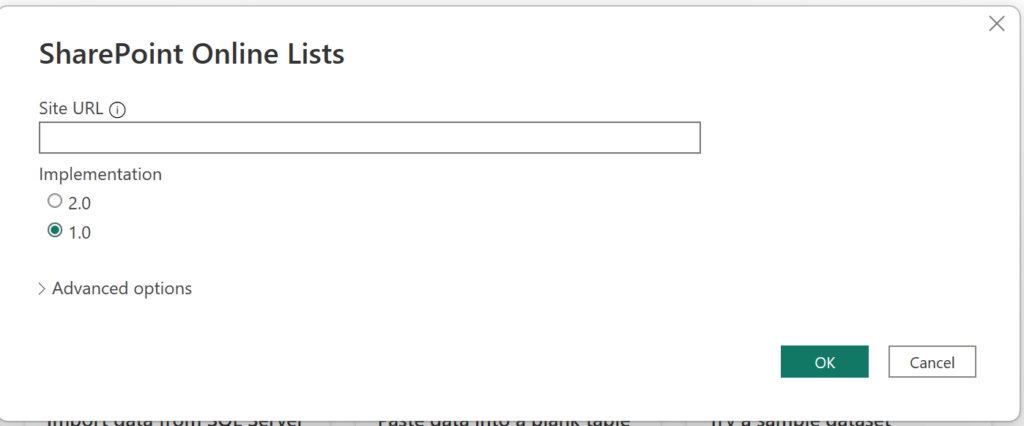
Regardless, we wanted simple and fast and so here we go with the SharePoint list. Fire up Power BI Desktop on your computer and select SharePoint list as a new data source. Add the site URL and click OK!
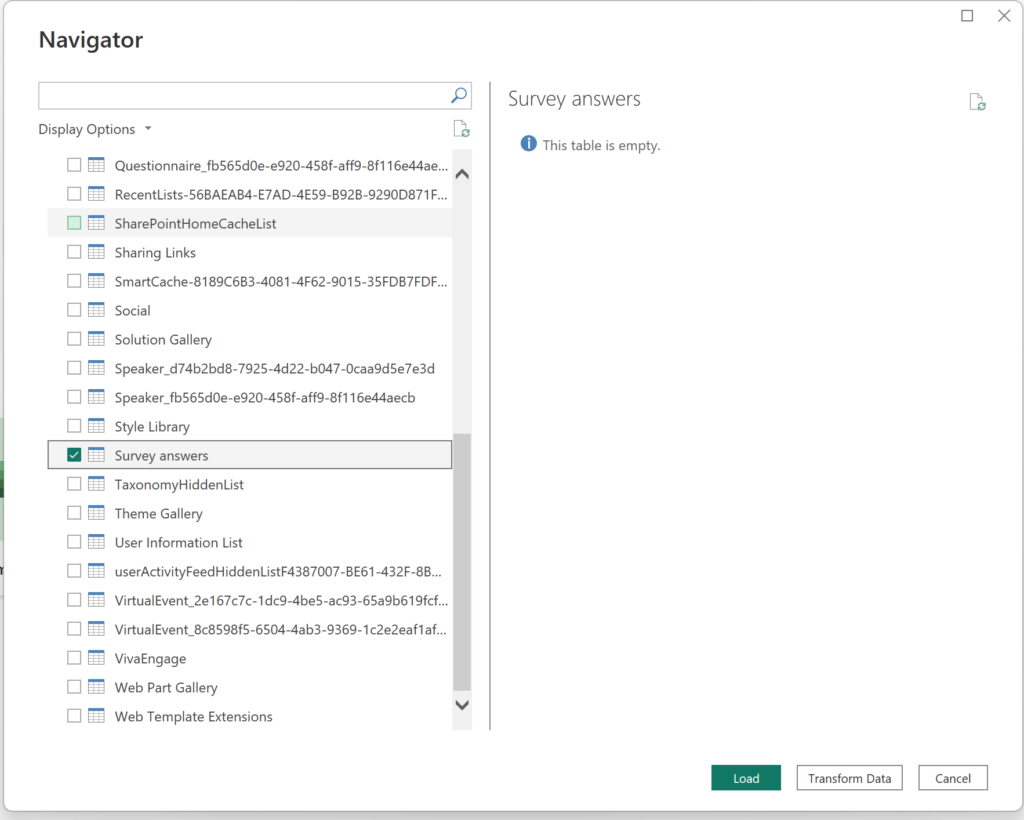
Select your list in the menu and click Transform Data!
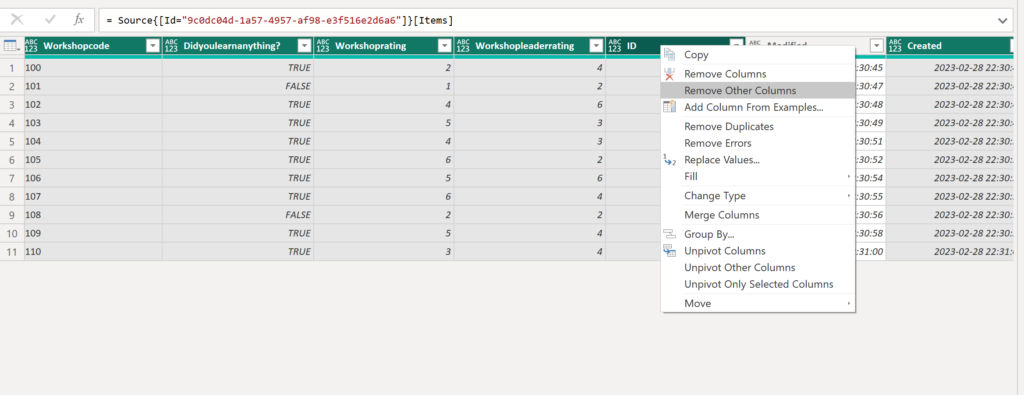
Remove columns you might not feel the need for, like this. If you’re starting to wonder why I added a field where you would add the workshop code, it’s because you might want to fetch data from another source that holds more information on the actual workshop like the amount of attendees, who led the workshop etc. Using this information there’s no need to specify who led the workshop as you already know that from another dataset and since you might know how many attended, you could also calculate the respons rate automatically.
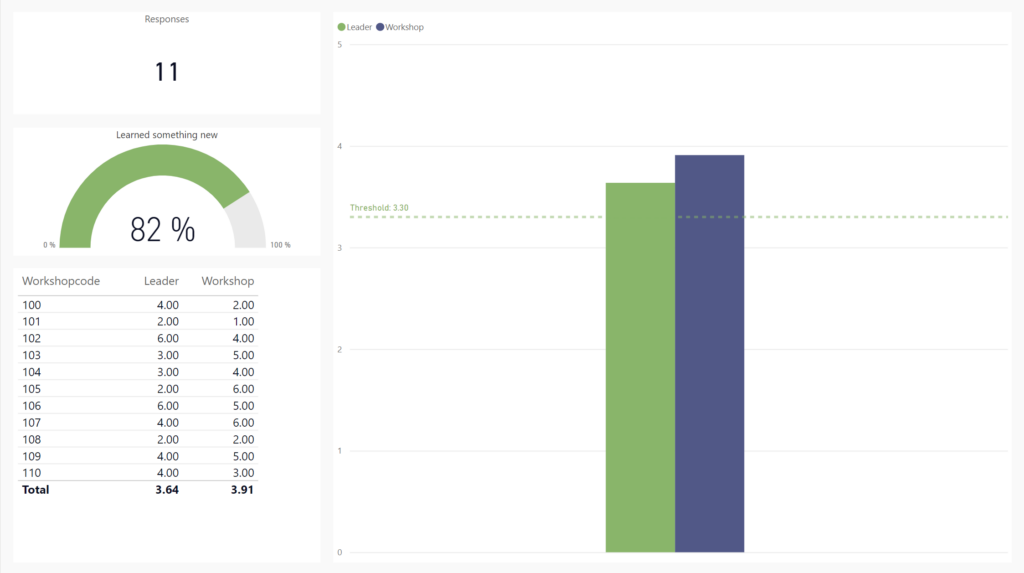
Add some visuals to your report canvas to make superior insights of greatness! (preferably better and with a better UX than what I’ve created here).
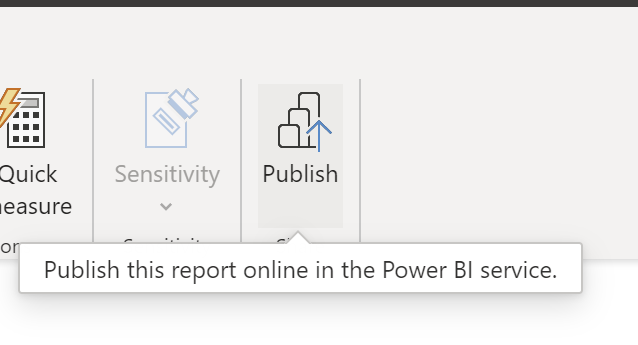
Finally you publish your report to the Power BI Service
Analyze
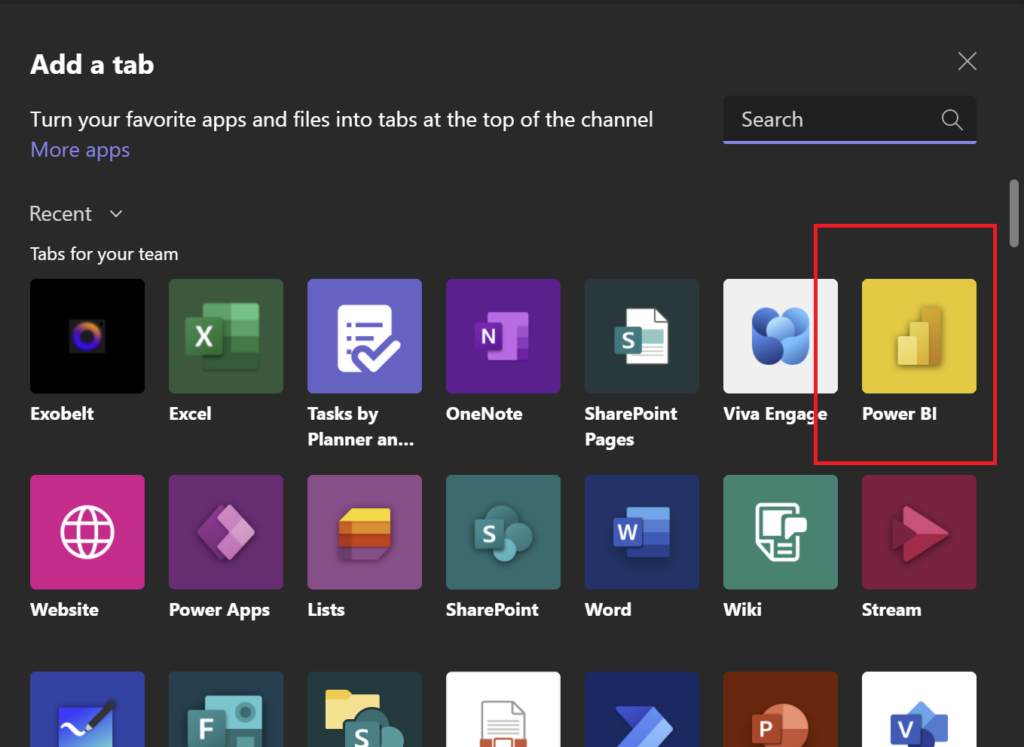
When the report is published, you need to add an update schedule for the data set and share the report with the correct people. Assuming this has been done, I recommend setting up the report as a tab in Microsoft Teams in a team where you have the people gathered that should be analyzing these metrics.
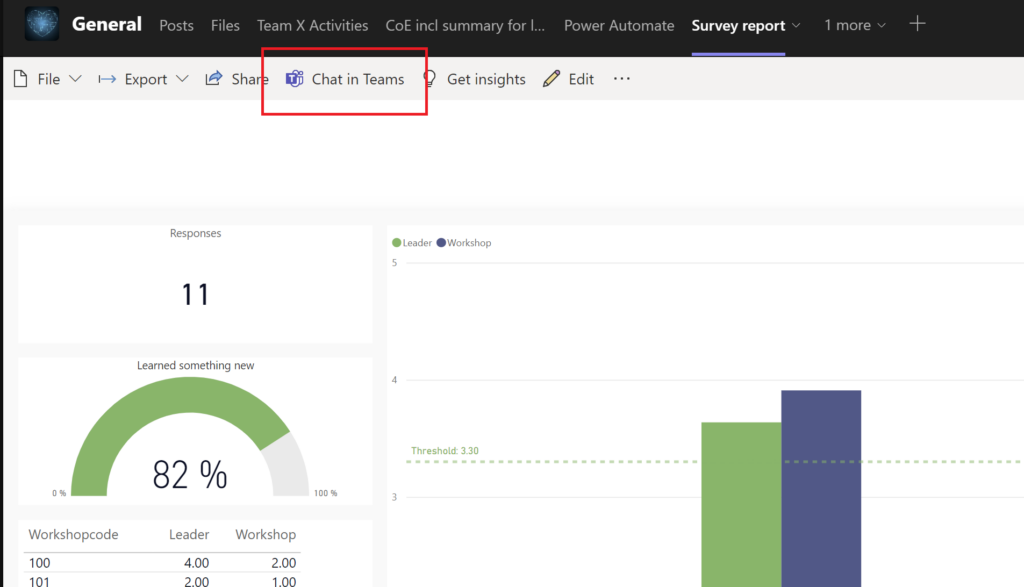
When analyzing the report, remember to make use of the Chat in Teams function! It’s awesome! This will create a bookmark to show the report exactly the way you see it.
Let’s say you have selected three workshop codes in the table (holding the CTRL key and clicking). It would look something like this:
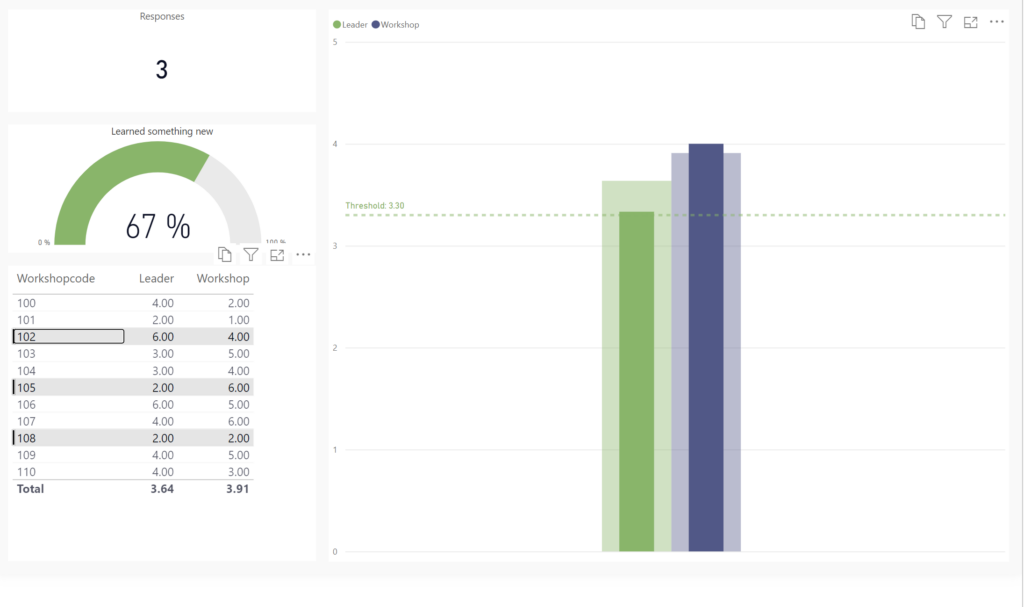
You are simply amazed by this incredible insight that is staring you in the face right now!
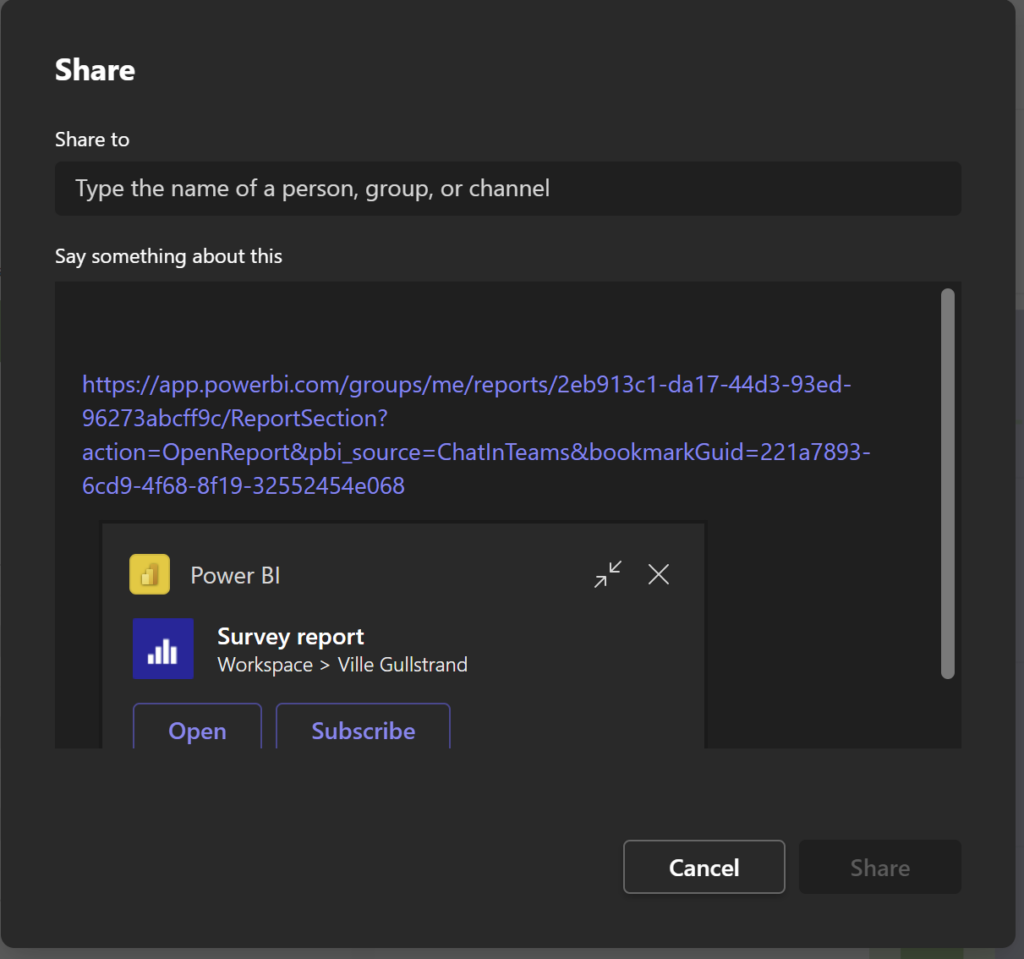
Clicking Share in Teams will create a link that will literally provide the exact same view to whoever clicks the link. No need to explain what filters to apply or what to do in order to get the same great insightful view that you managed to create yourself!
In summary
You can get really far with little effort. I have not shown the details of every step here, assuming you have some basic understanding of Microsoft 365 or at least the ability to search the web to fill the gaps. You can of course also reach out to me and I’ll help you out!
By the end of the day, I think that many of you who read this far will definitely have the skills to set this process up yourself and greatly improve your own survey process before the end of the week!
Cheers!